Collecting and Sorting Data
Challenge children to work collaboratively to plan and carry out a survey using tally charts or questionnaires. These five lessons clearly explain what makes a 'good' question and how to conduct a simple survey. Once they've done this - get them making bar charts, asking and answering questions and reporting back on their findings!
This downloadable series of Maths lessons includes lesson plans, slideshow presentations and printable teaching resources.
Interpreting Information
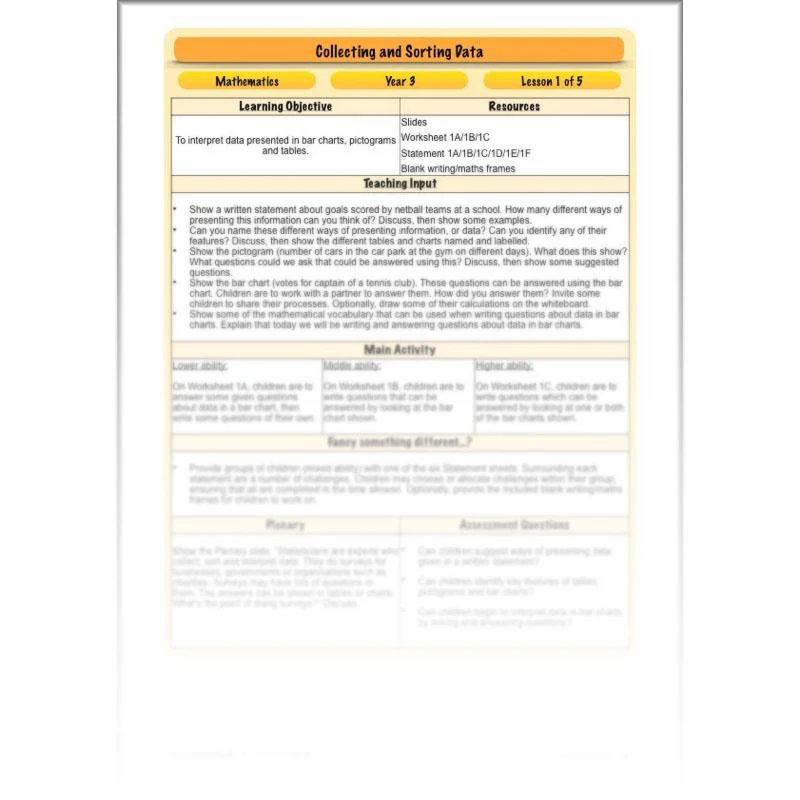
This lesson reminds children about the features of pictograms and bar charts, then it challenges them to interpret data presented both in tables and in charts. Will your children be able to answer questions about the data shown? Can they think of questions of their own, too?
This downloadable lesson comes with a lesson plan, a slideshow presentation and printable teaching resources.
What's included:
- Lesson plan
- Slides
- Activity ideas
- Differentiated worksheets
- Statement sheets
- Blank maths/writing frames
How can we do a survey?
The included slides with this lesson explain how to word questions if you want to present the data you collect using bar charts. Following on from this, children are challenged to prepare a range of questions with appropriate multiple-choice answers for a simple survey.
This downloadable lesson comes with a lesson plan, a slideshow presentation and printable teaching resources.
What's included:
- Lesson plan
- Slides
- Activity ideas
- Differentiated checklist sheets
- Worksheet
- Blank maths frame
Let's do a survey
In this lesson, children will work in groups to prepare a simple survey which can be carried out in school using tally charts or questionnaires. The included slides explain in straightforward terms how these can be made as well as challenging children to consider the pros and cons of each method.
This downloadable lesson includes a lesson plan, a slideshow presentation and printable teaching resources.
What's included:
- Lesson plan
- Slides
- Activity ideas
- Challenge cards
- Worksheet
- Questionnaire sheet
- Blank maths/writing frames
Presenting data with bar charts
This lesson builds your children's confidence with presenting data in bar charts. The straightforward explanations on the slides as well as the highly-differentiated activity and resources for this lesson will help you ensure that children with a wide range of abilities can present their survey data using bar charts. Some of your class will even decide on appropriate scales and draw bar charts from scratch!
This downloadable lesson includes a lesson plan, a slideshow presentation and printable teaching resources.
What's included:
- Lesson plan
- Slides
- Activity ideas
- Challenge cards
- Bar chart sheets
- Blank maths frame
Writing and Answering Questions
During this final lesson in the Complete Series, children will look at bar charts, attempting to answer given questions and write some of their own. The slides explain some simple but effective strategies children can use to help them solve one- and two-step word problems. There are even opportunities for children to produce simple reports about survey data they have previously collected!
This downloadable lesson includes a lesson plan, a slideshow presentation and printable teaching resources.
What's included:
- Lesson plan
- Slides
- Activity ideas
- Differentiated worksheets
- Survey reports
- Bar chart challenge sheets
Original: $4.71
-65%$4.71
$1.65More Images


Collecting and Sorting Data
Challenge children to work collaboratively to plan and carry out a survey using tally charts or questionnaires. These five lessons clearly explain what makes a 'good' question and how to conduct a simple survey. Once they've done this - get them making bar charts, asking and answering questions and reporting back on their findings!
This downloadable series of Maths lessons includes lesson plans, slideshow presentations and printable teaching resources.
Interpreting Information
This lesson reminds children about the features of pictograms and bar charts, then it challenges them to interpret data presented both in tables and in charts. Will your children be able to answer questions about the data shown? Can they think of questions of their own, too?
This downloadable lesson comes with a lesson plan, a slideshow presentation and printable teaching resources.
What's included:
- Lesson plan
- Slides
- Activity ideas
- Differentiated worksheets
- Statement sheets
- Blank maths/writing frames
How can we do a survey?
The included slides with this lesson explain how to word questions if you want to present the data you collect using bar charts. Following on from this, children are challenged to prepare a range of questions with appropriate multiple-choice answers for a simple survey.
This downloadable lesson comes with a lesson plan, a slideshow presentation and printable teaching resources.
What's included:
- Lesson plan
- Slides
- Activity ideas
- Differentiated checklist sheets
- Worksheet
- Blank maths frame
Let's do a survey
In this lesson, children will work in groups to prepare a simple survey which can be carried out in school using tally charts or questionnaires. The included slides explain in straightforward terms how these can be made as well as challenging children to consider the pros and cons of each method.
This downloadable lesson includes a lesson plan, a slideshow presentation and printable teaching resources.
What's included:
- Lesson plan
- Slides
- Activity ideas
- Challenge cards
- Worksheet
- Questionnaire sheet
- Blank maths/writing frames
Presenting data with bar charts
This lesson builds your children's confidence with presenting data in bar charts. The straightforward explanations on the slides as well as the highly-differentiated activity and resources for this lesson will help you ensure that children with a wide range of abilities can present their survey data using bar charts. Some of your class will even decide on appropriate scales and draw bar charts from scratch!
This downloadable lesson includes a lesson plan, a slideshow presentation and printable teaching resources.
What's included:
- Lesson plan
- Slides
- Activity ideas
- Challenge cards
- Bar chart sheets
- Blank maths frame
Writing and Answering Questions
During this final lesson in the Complete Series, children will look at bar charts, attempting to answer given questions and write some of their own. The slides explain some simple but effective strategies children can use to help them solve one- and two-step word problems. There are even opportunities for children to produce simple reports about survey data they have previously collected!
This downloadable lesson includes a lesson plan, a slideshow presentation and printable teaching resources.
What's included:
- Lesson plan
- Slides
- Activity ideas
- Differentiated worksheets
- Survey reports
- Bar chart challenge sheets
Product Information
Product Information
Shipping & Returns
Shipping & Returns
Description
Challenge children to work collaboratively to plan and carry out a survey using tally charts or questionnaires. These five lessons clearly explain what makes a 'good' question and how to conduct a simple survey. Once they've done this - get them making bar charts, asking and answering questions and reporting back on their findings!
This downloadable series of Maths lessons includes lesson plans, slideshow presentations and printable teaching resources.
Interpreting Information
This lesson reminds children about the features of pictograms and bar charts, then it challenges them to interpret data presented both in tables and in charts. Will your children be able to answer questions about the data shown? Can they think of questions of their own, too?
This downloadable lesson comes with a lesson plan, a slideshow presentation and printable teaching resources.
What's included:
- Lesson plan
- Slides
- Activity ideas
- Differentiated worksheets
- Statement sheets
- Blank maths/writing frames
How can we do a survey?
The included slides with this lesson explain how to word questions if you want to present the data you collect using bar charts. Following on from this, children are challenged to prepare a range of questions with appropriate multiple-choice answers for a simple survey.
This downloadable lesson comes with a lesson plan, a slideshow presentation and printable teaching resources.
What's included:
- Lesson plan
- Slides
- Activity ideas
- Differentiated checklist sheets
- Worksheet
- Blank maths frame
Let's do a survey
In this lesson, children will work in groups to prepare a simple survey which can be carried out in school using tally charts or questionnaires. The included slides explain in straightforward terms how these can be made as well as challenging children to consider the pros and cons of each method.
This downloadable lesson includes a lesson plan, a slideshow presentation and printable teaching resources.
What's included:
- Lesson plan
- Slides
- Activity ideas
- Challenge cards
- Worksheet
- Questionnaire sheet
- Blank maths/writing frames
Presenting data with bar charts
This lesson builds your children's confidence with presenting data in bar charts. The straightforward explanations on the slides as well as the highly-differentiated activity and resources for this lesson will help you ensure that children with a wide range of abilities can present their survey data using bar charts. Some of your class will even decide on appropriate scales and draw bar charts from scratch!
This downloadable lesson includes a lesson plan, a slideshow presentation and printable teaching resources.
What's included:
- Lesson plan
- Slides
- Activity ideas
- Challenge cards
- Bar chart sheets
- Blank maths frame
Writing and Answering Questions
During this final lesson in the Complete Series, children will look at bar charts, attempting to answer given questions and write some of their own. The slides explain some simple but effective strategies children can use to help them solve one- and two-step word problems. There are even opportunities for children to produce simple reports about survey data they have previously collected!
This downloadable lesson includes a lesson plan, a slideshow presentation and printable teaching resources.
What's included:
- Lesson plan
- Slides
- Activity ideas
- Differentiated worksheets
- Survey reports
- Bar chart challenge sheets