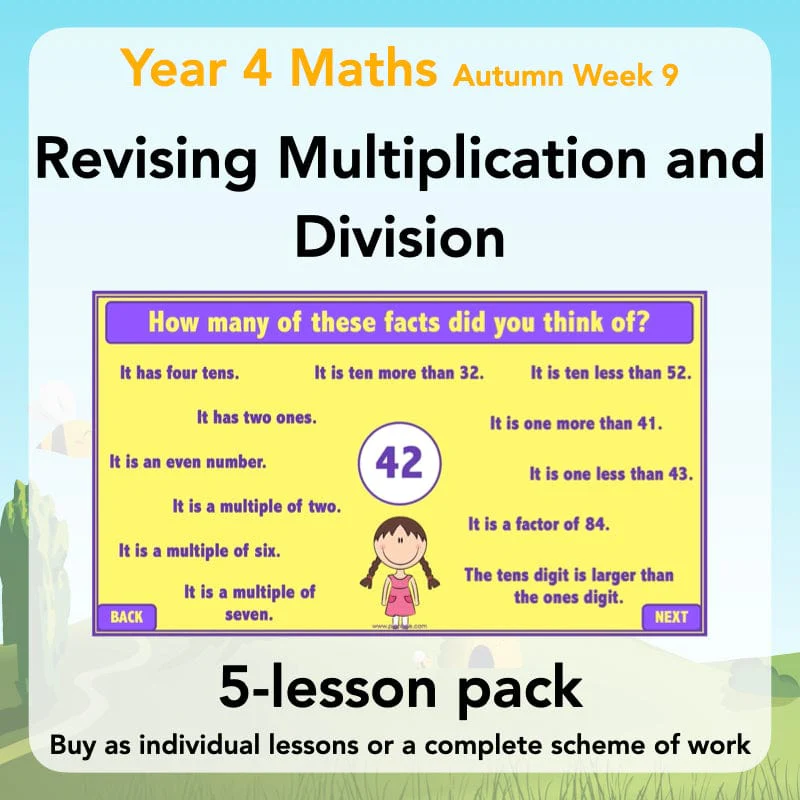
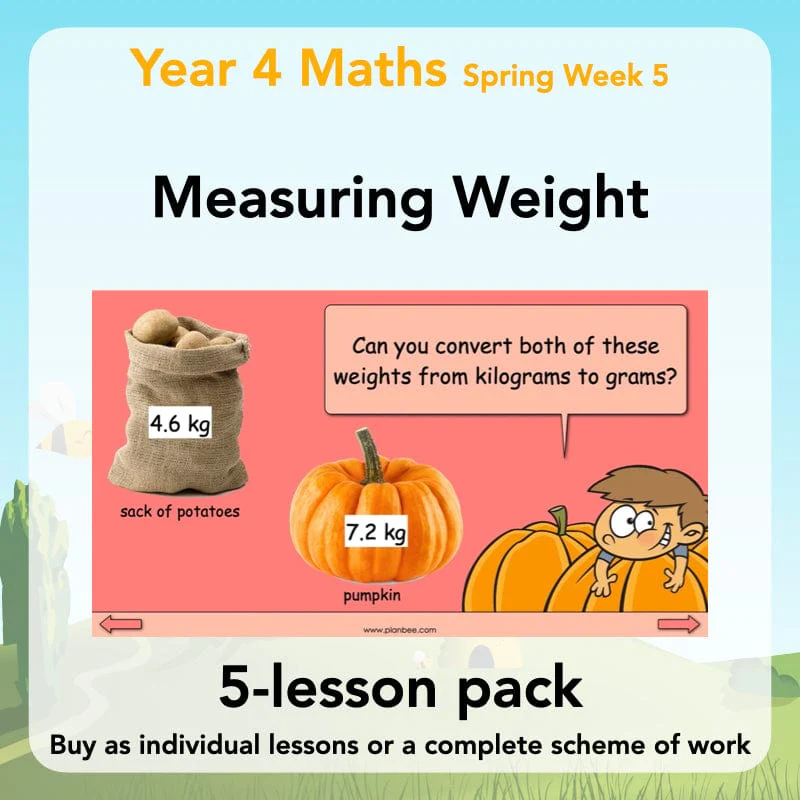
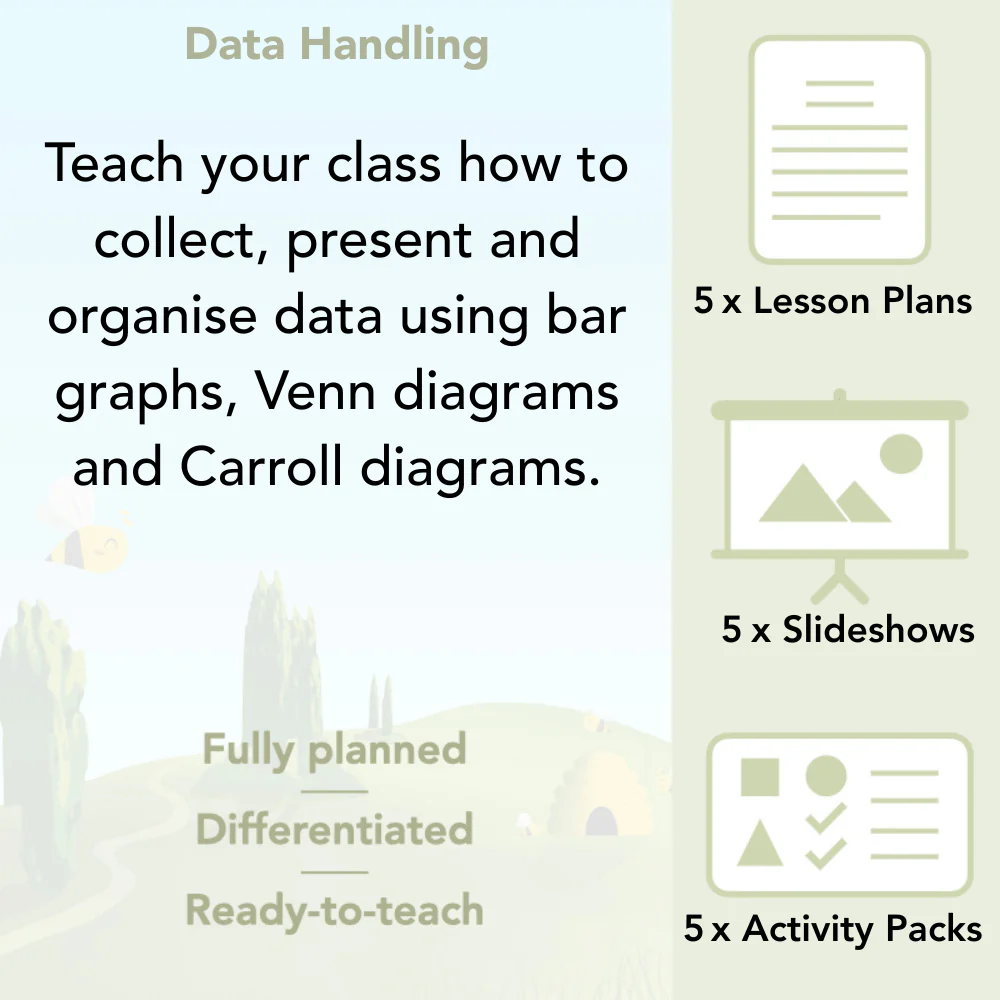
Data Handling
This 'Data Handling' scheme of work for Year 4 is a great way to teach your class how to collect, present and organise various types of data through a variety of fun activities.
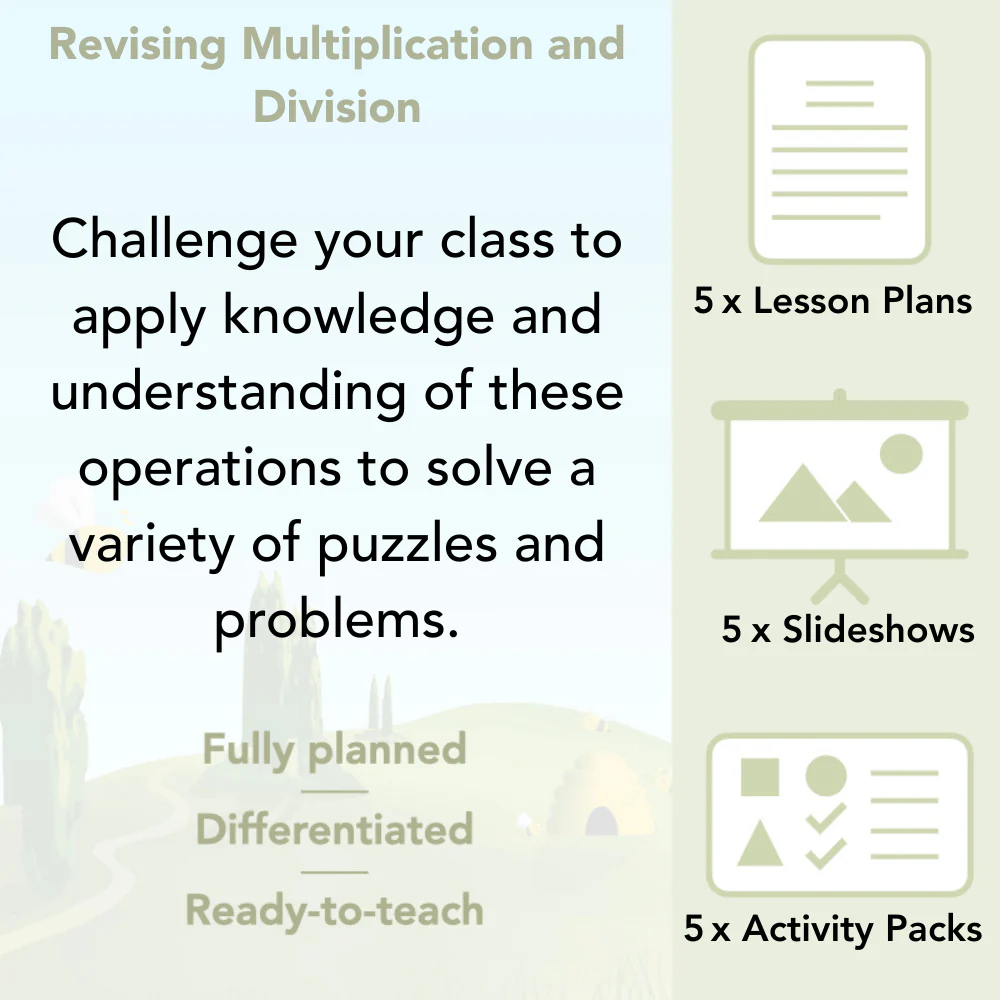
They will start by asking questions and learning how to collect data to answer these questions, how to present and analyse information in bar graphs, as well as how to sort information into Venn and Carroll diagrams.
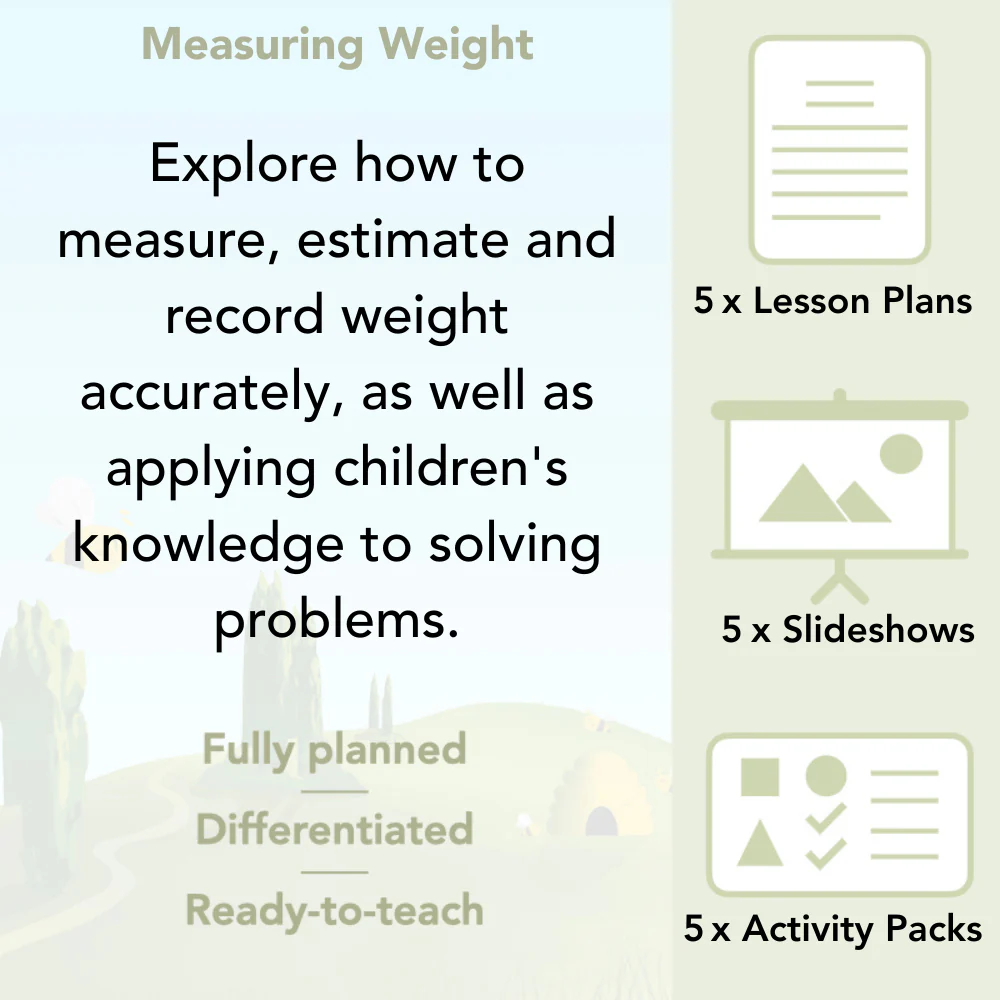
This downloadable series of five lessons includes a lesson plan, slideshow presentation and printable teaching resources.
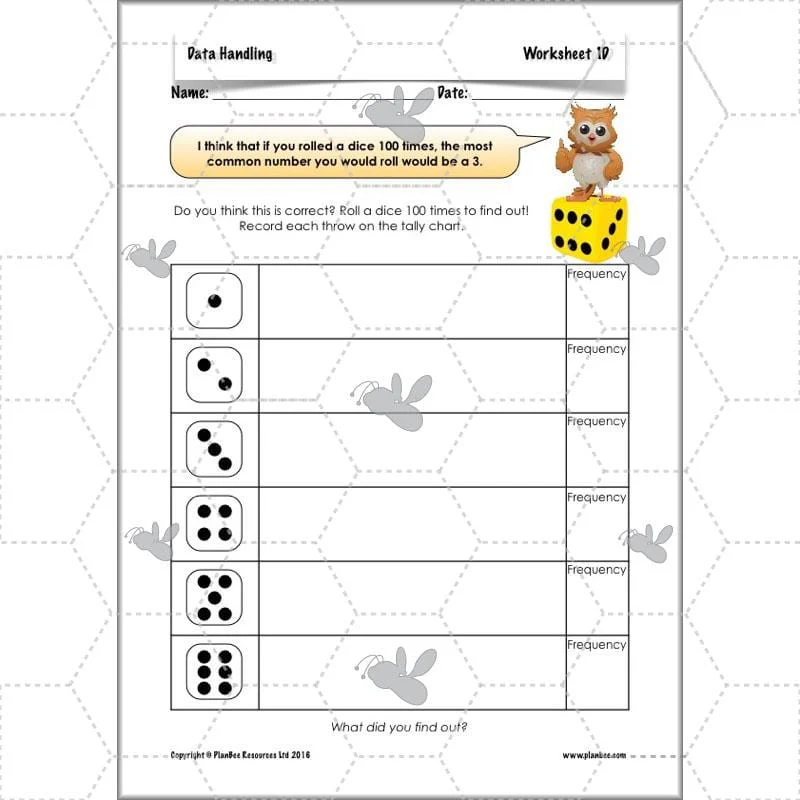
Lesson 1: Questions and Answers
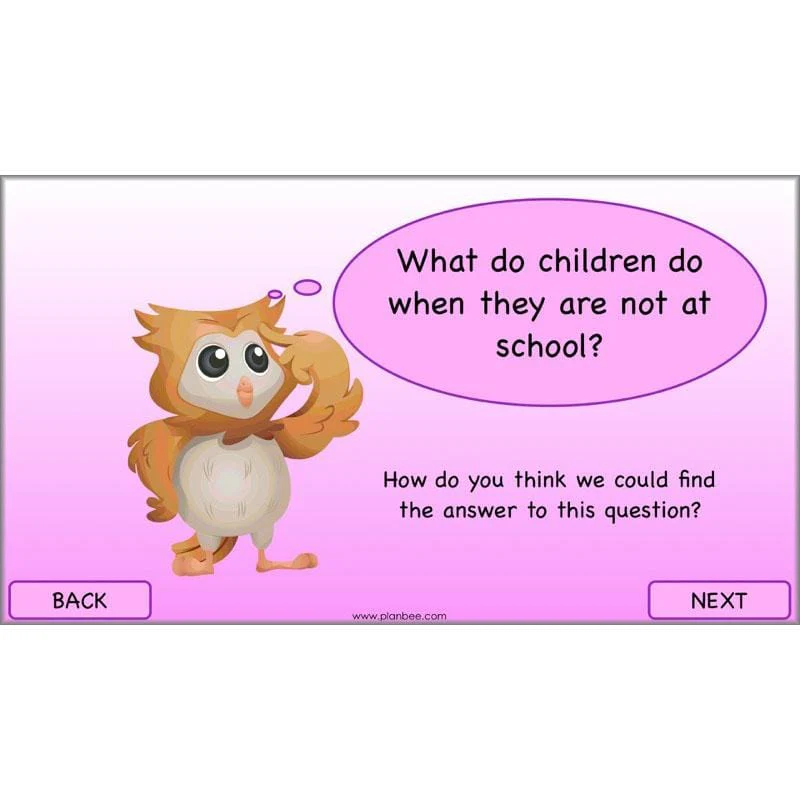
Once you've decided on something you want to find out more about, how do you write good questions for a survey?
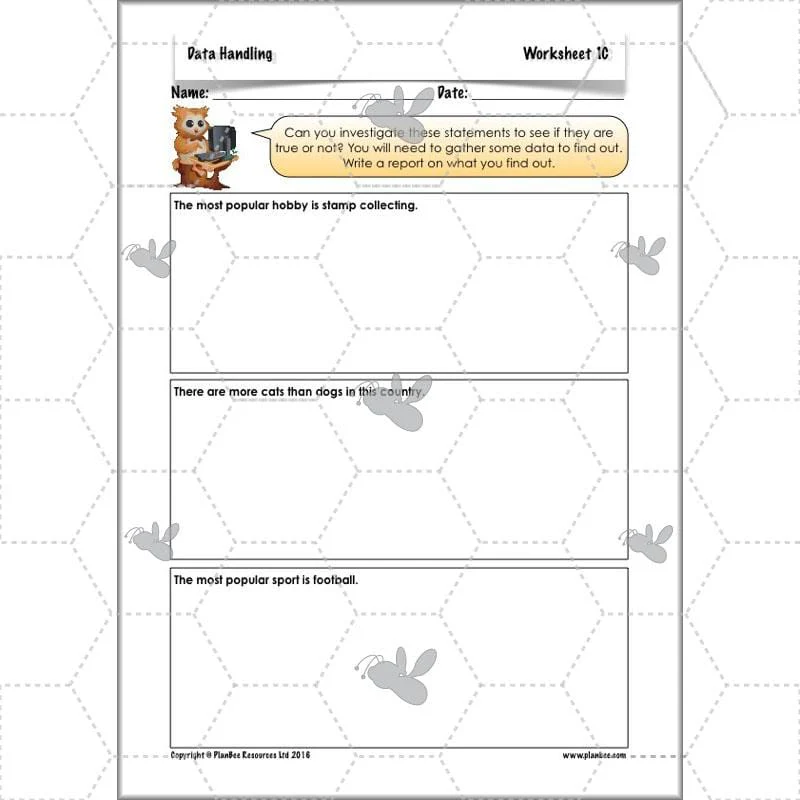
Find out how to ask and answer useful and appropriate questions when collecting data as well as how to use tables and tallies to help you!
This downloadable lesson contains a lesson plan, a slideshow presentation and printable teaching resources.
What's included:
- Lesson plan
- Slides
- Activity ideas
- Differentiated worksheets
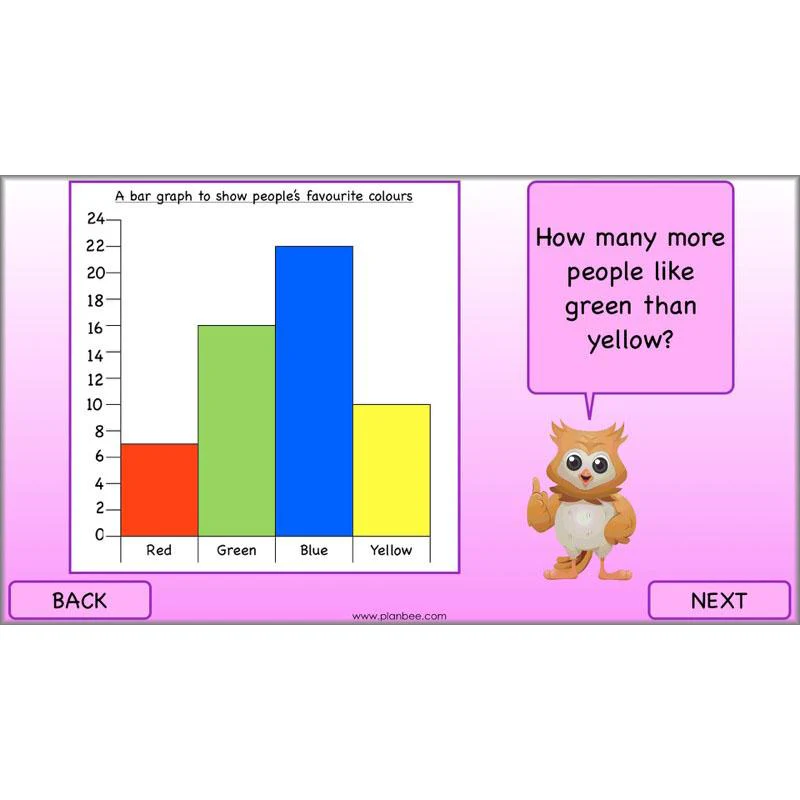
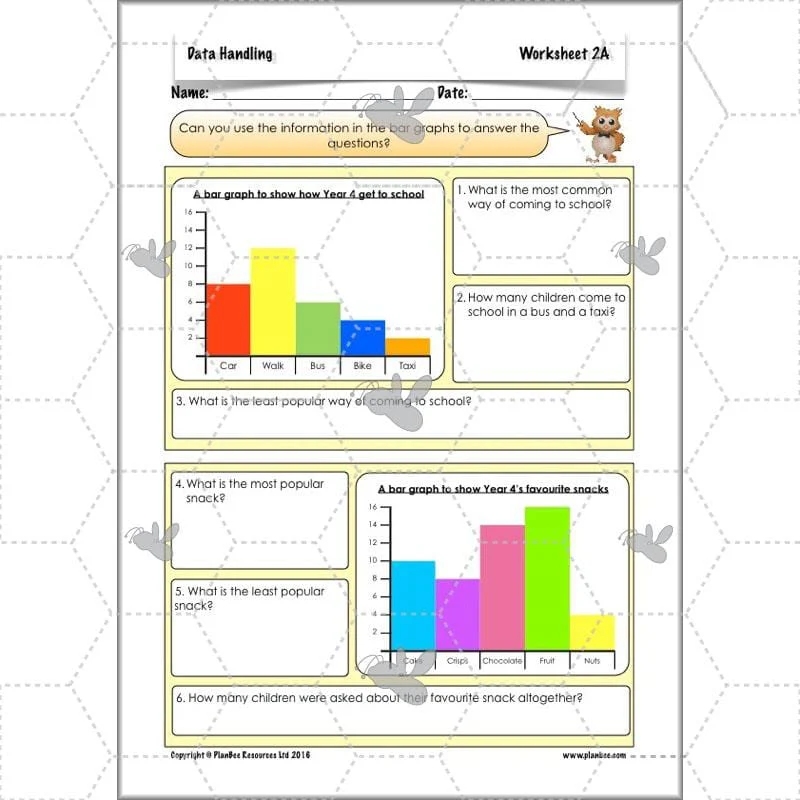
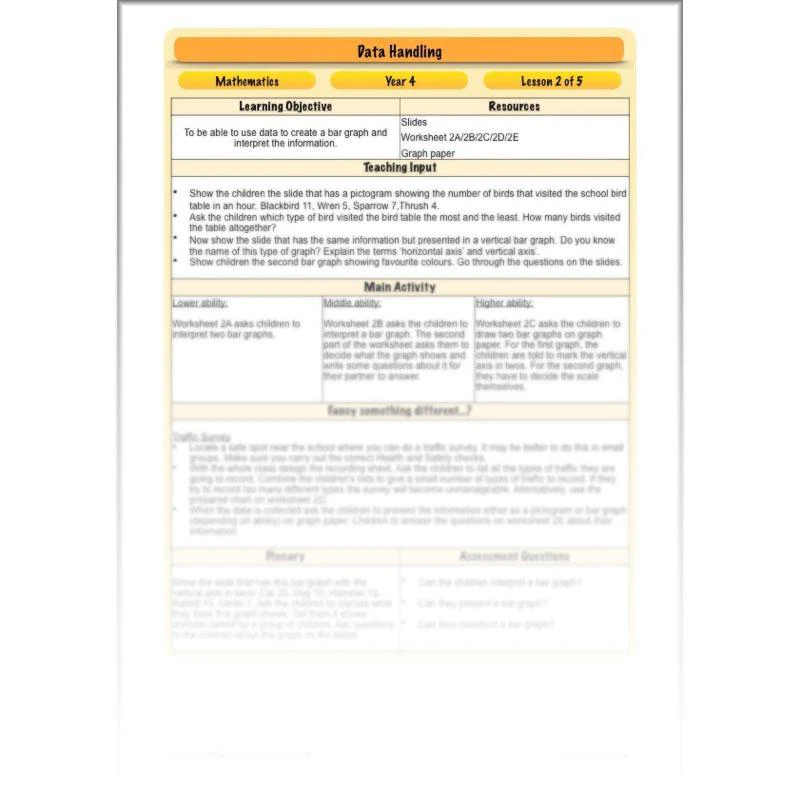
Lesson 2: How Bar Charts Work
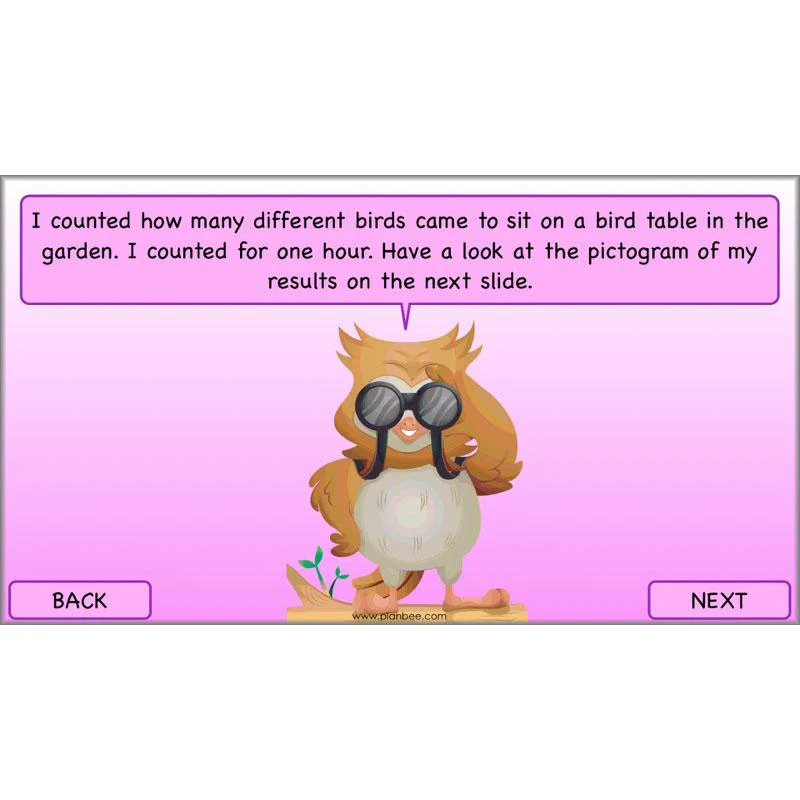
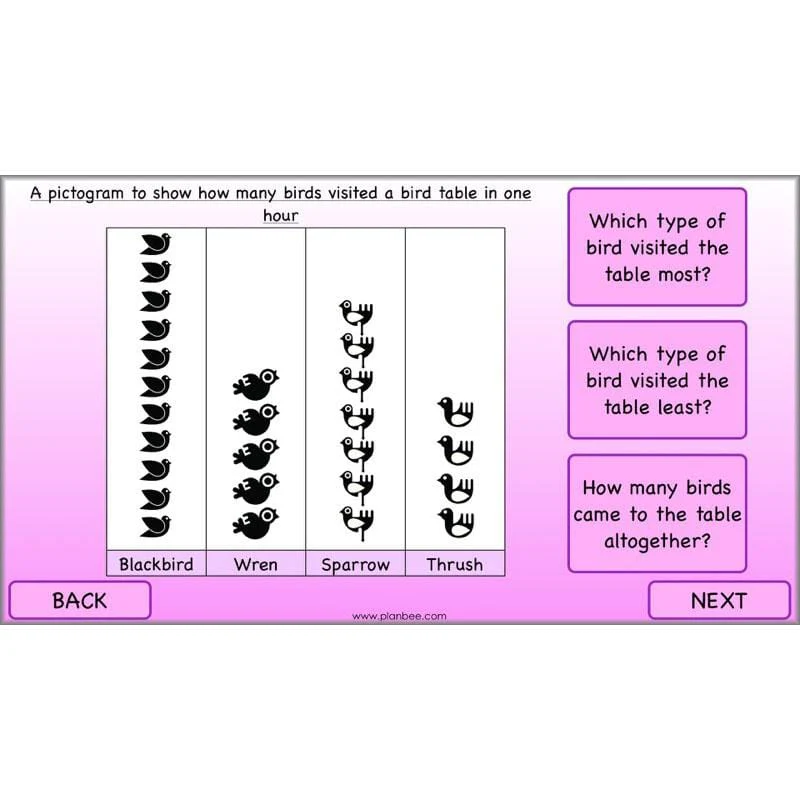
What can we learn from looking at data presented using tables and bar charts? What questions can we ask and answer by looking at them?
Challenge children to consider these questions, then get them generating questions of their own as they study various different sets of data given in bar charts.
This downloadable lesson includes a lesson plan, a slideshow presentation and printable teaching resources.
What's included:
- Lesson plan
- Slides
- Activity ideas
- Differentiated worksheets
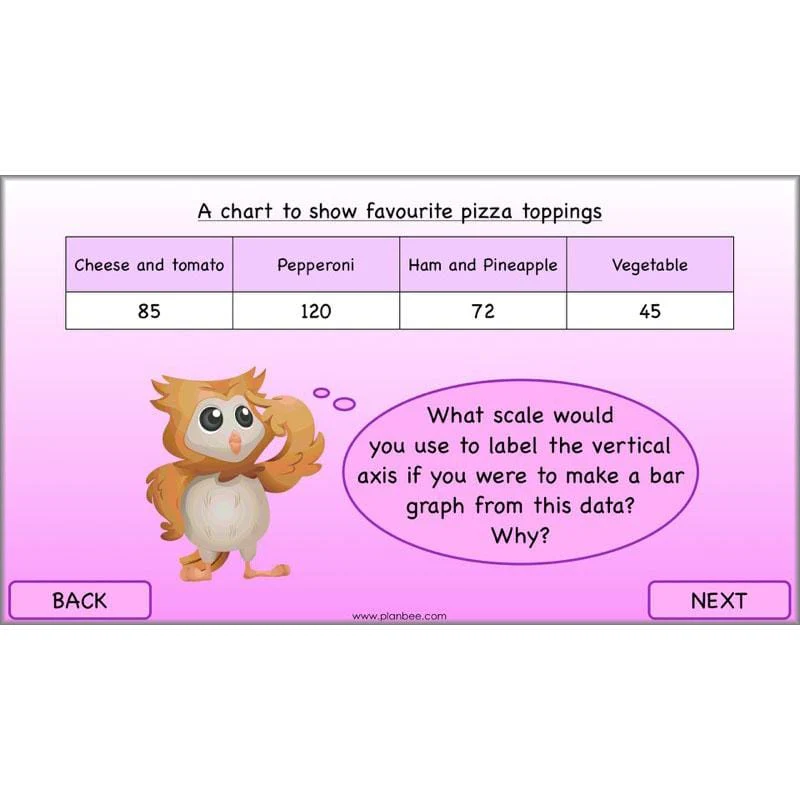
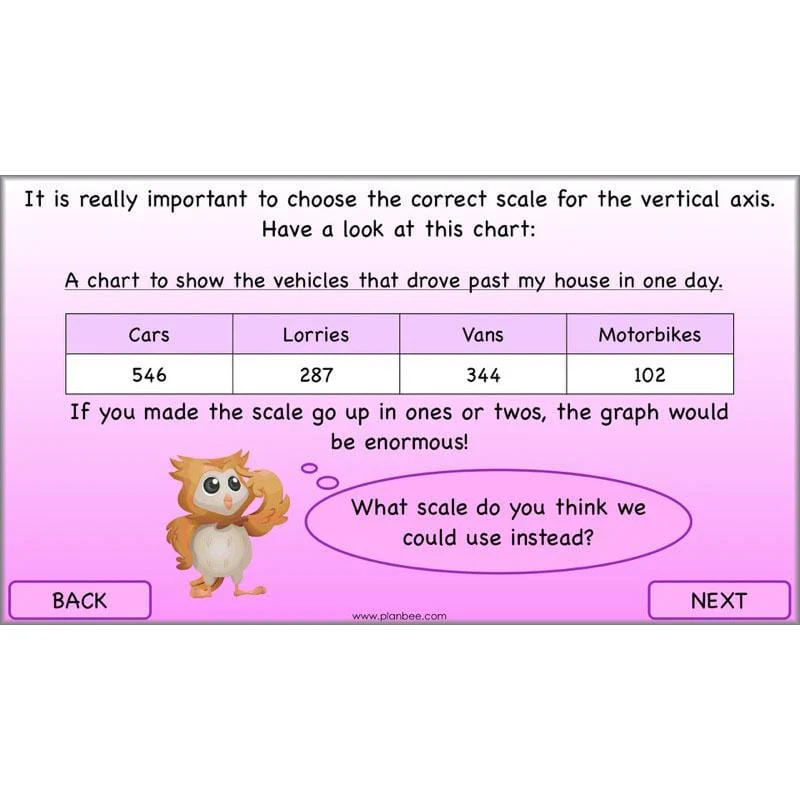
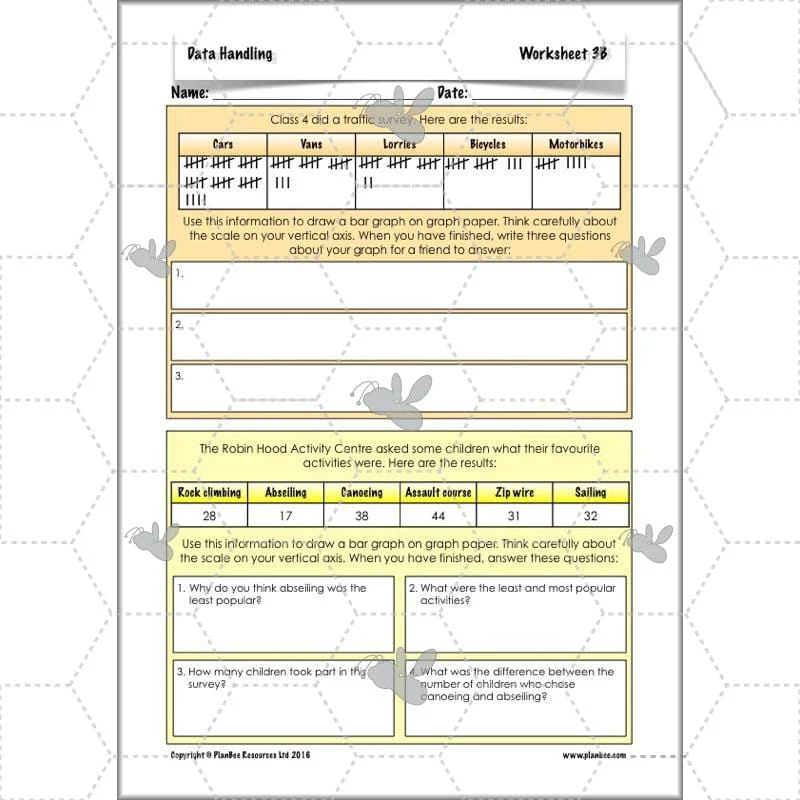
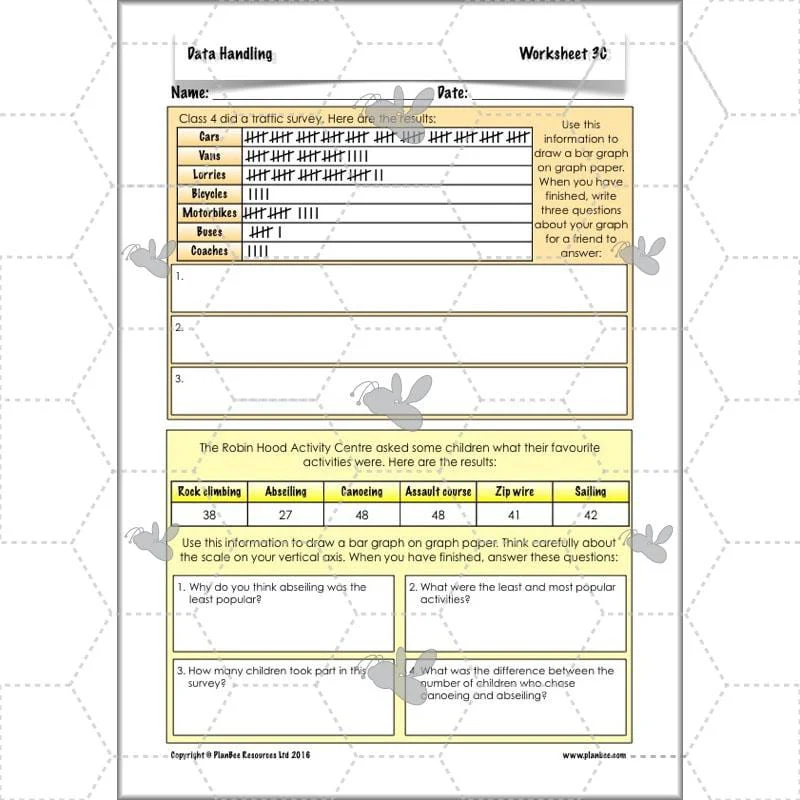
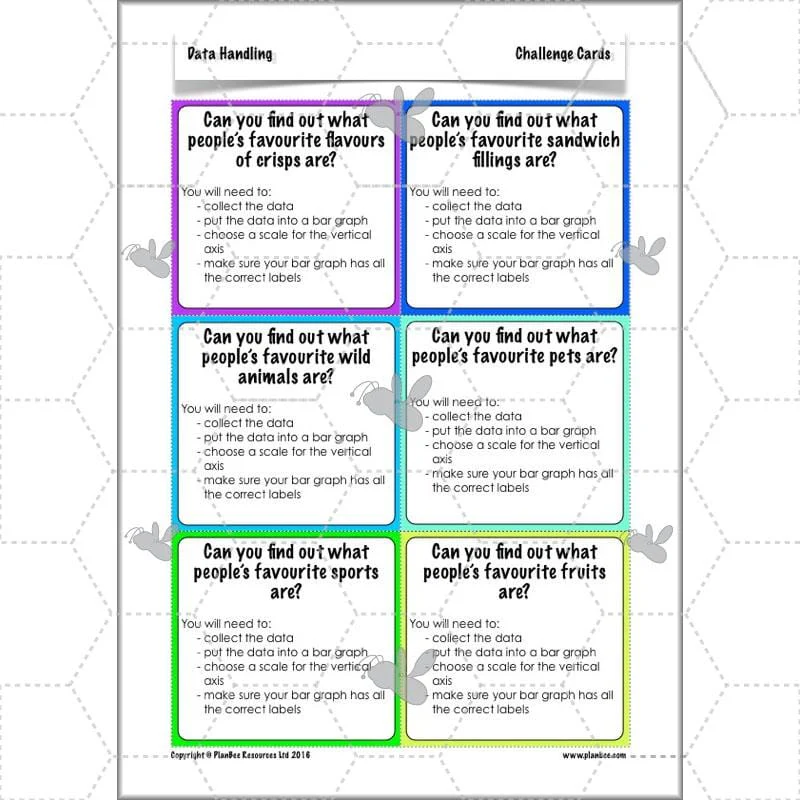
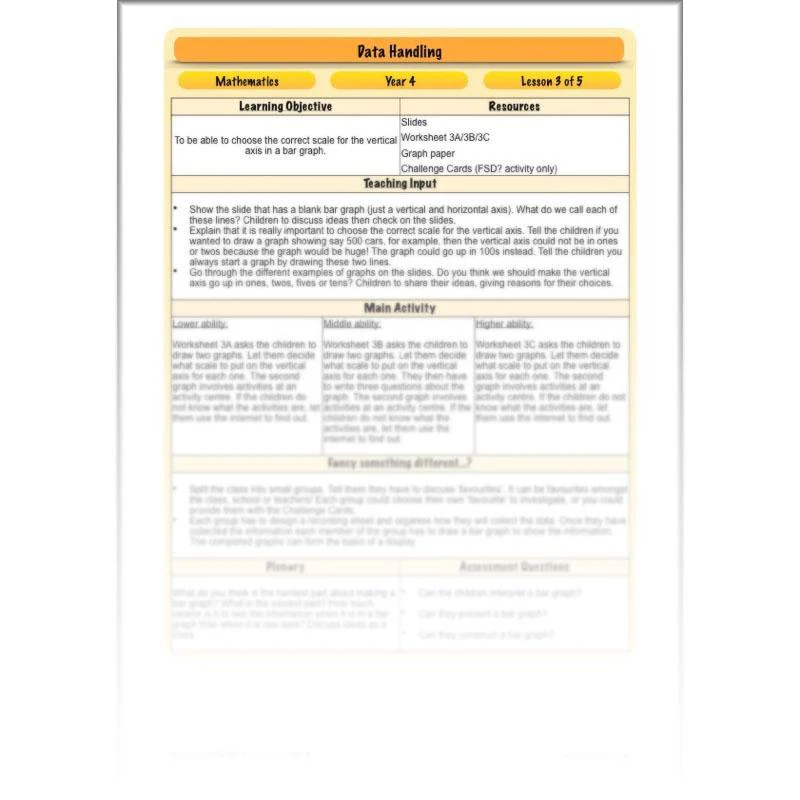
Lesson 3: Choose the Right Scale
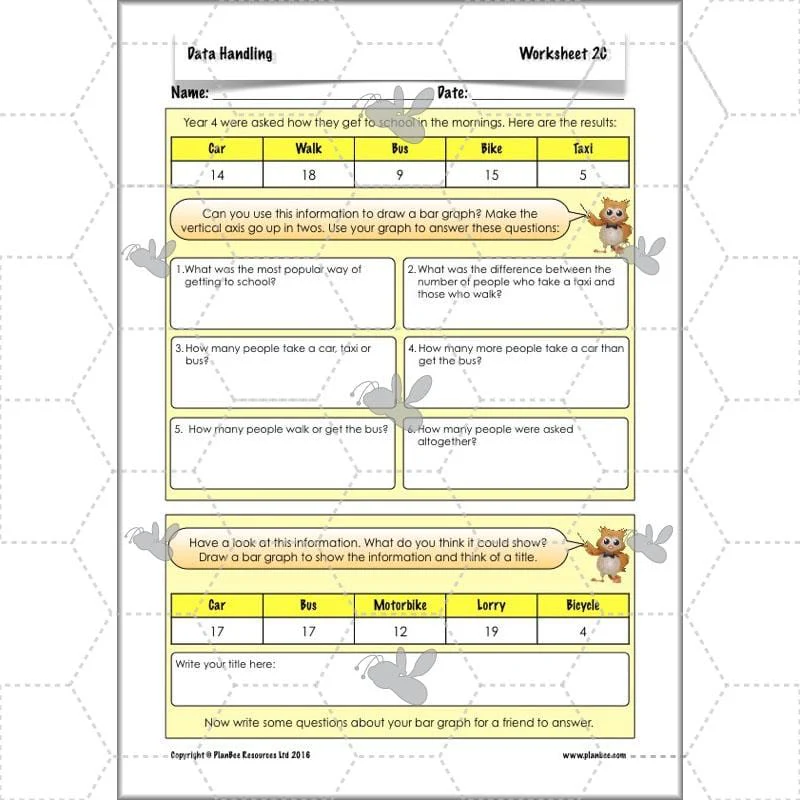
The included slides with this lesson clearly explain how to draw the axes and labels on a bar chart as well as how to choose an appropriate scale, depending on the data you are presenting.
Children can then put what they've learned into practice straight away during either of the two included activities!
This downloadable lesson includes a lesson plan, a slideshow presentation and printable teaching resources.
What's included:
- Lesson plan
- Slides
- Activity ideas
- Differentiated worksheets
- Challenge cards
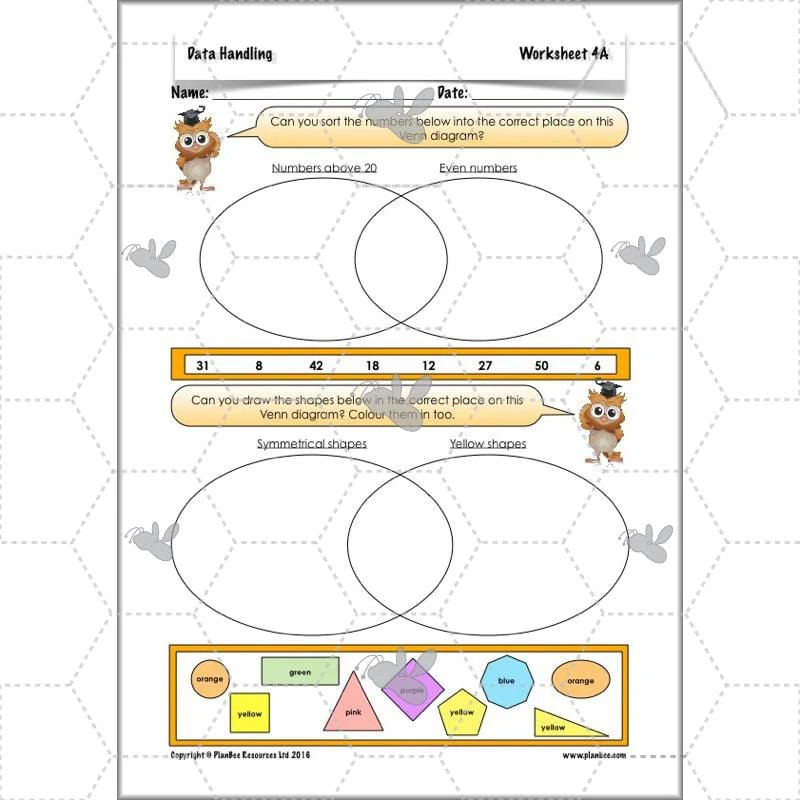
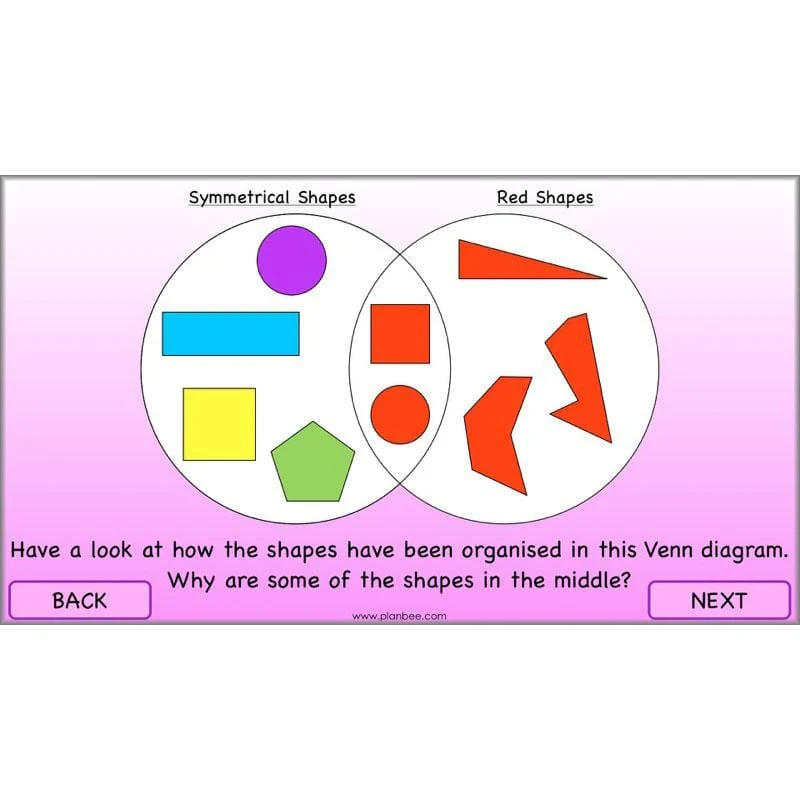
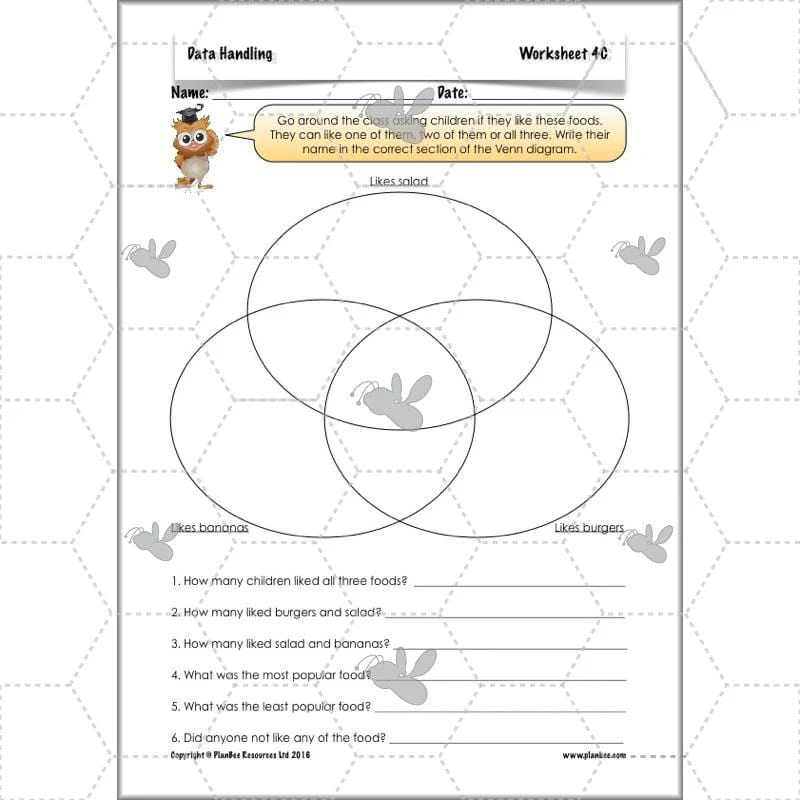
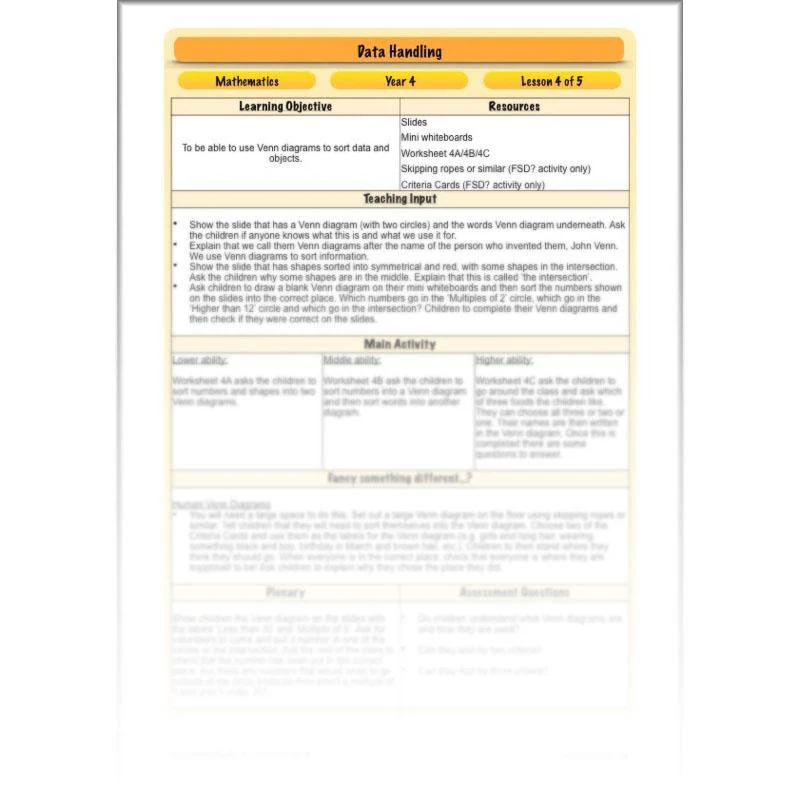
Lesson 4: Venn Diagrams
Remind children what Venn diagrams are and how they are used, then explore the ways in which data or objects can be sorted using a Venn diagram with one intersection.
In either of the included activities, children can practise sorting using given criteria, or try to generate Venn diagram criteria of their own.
This downloadable lesson includes a lesson plan, a slideshow presentation and printable teaching resources.
What's included:
- Lesson plan
- Slides
- Activity ideas
- Differentiated worksheets
- Criteria cards
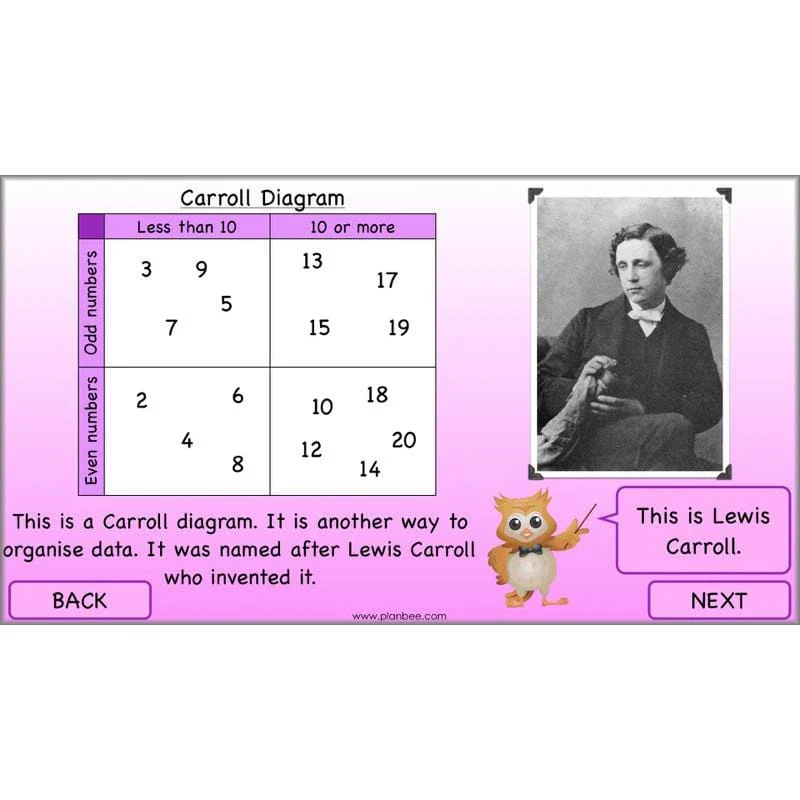
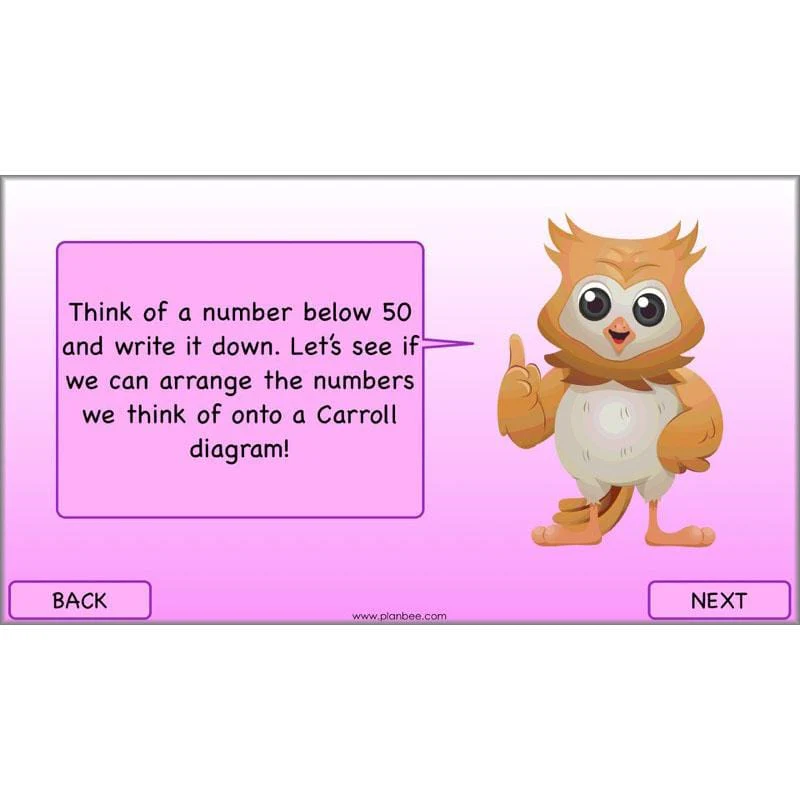
Lesson 5: Carroll Diagrams
What are Carroll diagrams? What can we learn from looking at data presented using them? How can we come up with criteria when making our own Carroll diagrams?
Challenge children to consider these questions, then either get them sorting data using given criteria, or generating their own criteria for Carroll diagrams.
This downloadable lesson comes with a lesson plan, a slideshow presentation and printable teaching resources.
What's included:
- Lesson plan
- Slides
- Activity ideas
- Differentiated worksheets
- Blank Carroll diagram
- Challenge cards
Original: $4.71
-65%$4.71
$1.65More Images


Data Handling
This 'Data Handling' scheme of work for Year 4 is a great way to teach your class how to collect, present and organise various types of data through a variety of fun activities.
They will start by asking questions and learning how to collect data to answer these questions, how to present and analyse information in bar graphs, as well as how to sort information into Venn and Carroll diagrams.
This downloadable series of five lessons includes a lesson plan, slideshow presentation and printable teaching resources.
Lesson 1: Questions and Answers
Once you've decided on something you want to find out more about, how do you write good questions for a survey?
Find out how to ask and answer useful and appropriate questions when collecting data as well as how to use tables and tallies to help you!
This downloadable lesson contains a lesson plan, a slideshow presentation and printable teaching resources.
What's included:
- Lesson plan
- Slides
- Activity ideas
- Differentiated worksheets
Lesson 2: How Bar Charts Work
What can we learn from looking at data presented using tables and bar charts? What questions can we ask and answer by looking at them?
Challenge children to consider these questions, then get them generating questions of their own as they study various different sets of data given in bar charts.
This downloadable lesson includes a lesson plan, a slideshow presentation and printable teaching resources.
What's included:
- Lesson plan
- Slides
- Activity ideas
- Differentiated worksheets
Lesson 3: Choose the Right Scale
The included slides with this lesson clearly explain how to draw the axes and labels on a bar chart as well as how to choose an appropriate scale, depending on the data you are presenting.
Children can then put what they've learned into practice straight away during either of the two included activities!
This downloadable lesson includes a lesson plan, a slideshow presentation and printable teaching resources.
What's included:
- Lesson plan
- Slides
- Activity ideas
- Differentiated worksheets
- Challenge cards
Lesson 4: Venn Diagrams
Remind children what Venn diagrams are and how they are used, then explore the ways in which data or objects can be sorted using a Venn diagram with one intersection.
In either of the included activities, children can practise sorting using given criteria, or try to generate Venn diagram criteria of their own.
This downloadable lesson includes a lesson plan, a slideshow presentation and printable teaching resources.
What's included:
- Lesson plan
- Slides
- Activity ideas
- Differentiated worksheets
- Criteria cards
Lesson 5: Carroll Diagrams
What are Carroll diagrams? What can we learn from looking at data presented using them? How can we come up with criteria when making our own Carroll diagrams?
Challenge children to consider these questions, then either get them sorting data using given criteria, or generating their own criteria for Carroll diagrams.
This downloadable lesson comes with a lesson plan, a slideshow presentation and printable teaching resources.
What's included:
- Lesson plan
- Slides
- Activity ideas
- Differentiated worksheets
- Blank Carroll diagram
- Challenge cards
Product Information
Product Information
Shipping & Returns
Shipping & Returns
Description
This 'Data Handling' scheme of work for Year 4 is a great way to teach your class how to collect, present and organise various types of data through a variety of fun activities.
They will start by asking questions and learning how to collect data to answer these questions, how to present and analyse information in bar graphs, as well as how to sort information into Venn and Carroll diagrams.
This downloadable series of five lessons includes a lesson plan, slideshow presentation and printable teaching resources.
Lesson 1: Questions and Answers
Once you've decided on something you want to find out more about, how do you write good questions for a survey?
Find out how to ask and answer useful and appropriate questions when collecting data as well as how to use tables and tallies to help you!
This downloadable lesson contains a lesson plan, a slideshow presentation and printable teaching resources.
What's included:
- Lesson plan
- Slides
- Activity ideas
- Differentiated worksheets
Lesson 2: How Bar Charts Work
What can we learn from looking at data presented using tables and bar charts? What questions can we ask and answer by looking at them?
Challenge children to consider these questions, then get them generating questions of their own as they study various different sets of data given in bar charts.
This downloadable lesson includes a lesson plan, a slideshow presentation and printable teaching resources.
What's included:
- Lesson plan
- Slides
- Activity ideas
- Differentiated worksheets
Lesson 3: Choose the Right Scale
The included slides with this lesson clearly explain how to draw the axes and labels on a bar chart as well as how to choose an appropriate scale, depending on the data you are presenting.
Children can then put what they've learned into practice straight away during either of the two included activities!
This downloadable lesson includes a lesson plan, a slideshow presentation and printable teaching resources.
What's included:
- Lesson plan
- Slides
- Activity ideas
- Differentiated worksheets
- Challenge cards
Lesson 4: Venn Diagrams
Remind children what Venn diagrams are and how they are used, then explore the ways in which data or objects can be sorted using a Venn diagram with one intersection.
In either of the included activities, children can practise sorting using given criteria, or try to generate Venn diagram criteria of their own.
This downloadable lesson includes a lesson plan, a slideshow presentation and printable teaching resources.
What's included:
- Lesson plan
- Slides
- Activity ideas
- Differentiated worksheets
- Criteria cards
Lesson 5: Carroll Diagrams
What are Carroll diagrams? What can we learn from looking at data presented using them? How can we come up with criteria when making our own Carroll diagrams?
Challenge children to consider these questions, then either get them sorting data using given criteria, or generating their own criteria for Carroll diagrams.
This downloadable lesson comes with a lesson plan, a slideshow presentation and printable teaching resources.
What's included:
- Lesson plan
- Slides
- Activity ideas
- Differentiated worksheets
- Blank Carroll diagram
- Challenge cards