Let’s explore charts and tables
Explore tally charts, tables, pictograms and block diagrams in this scheme of work for Year 2. Your class will input given data into tables and charts, as well as generating some data of their own. They will be challenged to ask and answer questions about their tables and graphs.
This downloadable series of lessons includes lesson plans, slideshow presentations and printable teaching resources.
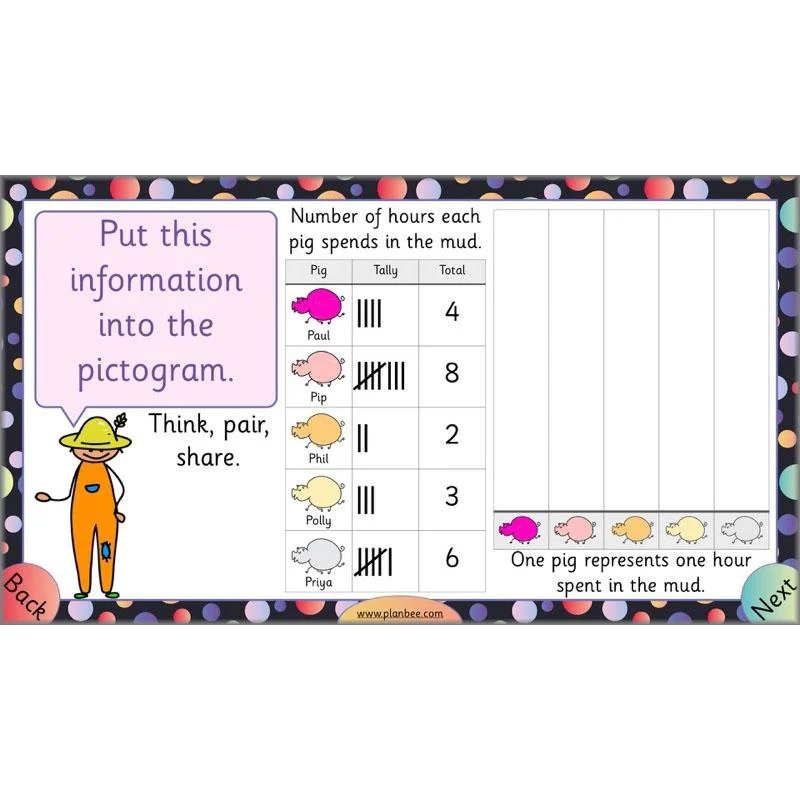
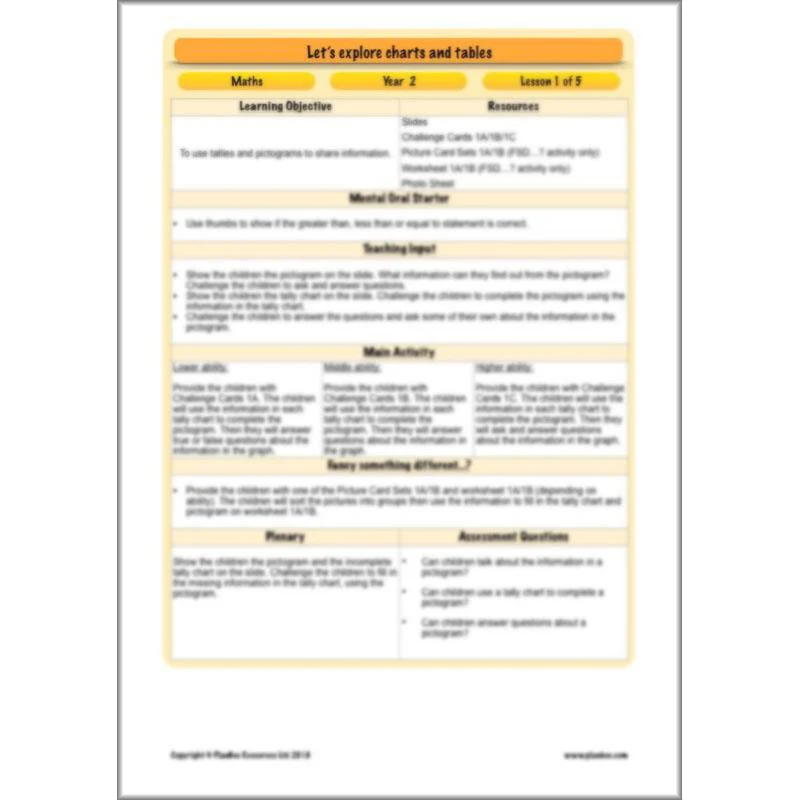
Using tallies and pictograms
In the first lesson in this series your class will explore pictograms and tally charts. They will ask and answer questions about the data they can see. The children will also use given information to complete tally charts and pictograms.
This downloadable Year 2 Tallies and Pictograms lesson includes a lesson plan, a slideshow presentation and printable teaching resources.
What's included:
- Lesson plan
- Slides
- Activity ideas
- Challenge Cards
- Picture Cards
- Worksheet
- Photo Sheet
View Lesson 1
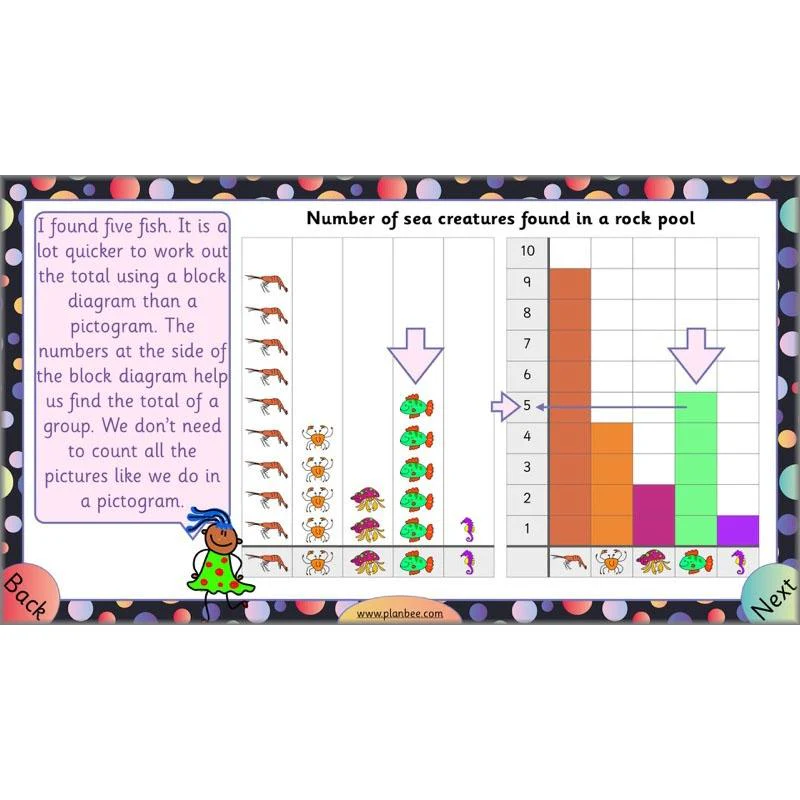
Compare pictograms and block diagrams
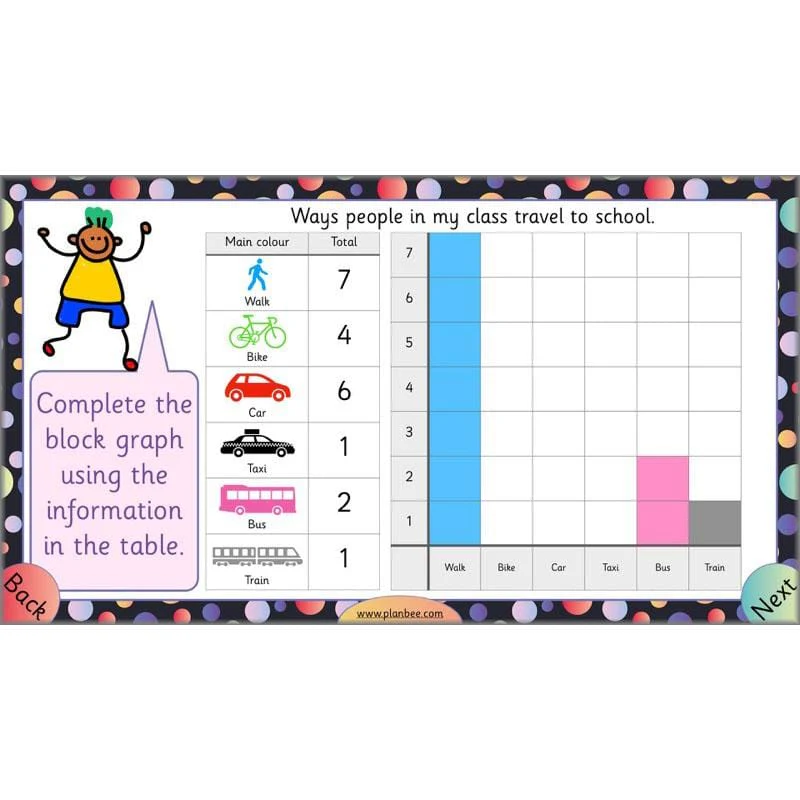
In the second lesson of this series your class will compare pictograms and block diagrams. They will see the same information recorded in the two styles of graphs and talk about how they will use the graphs to answer given questions. They will discuss how the graphs are the same and how they are different. Your class will also have the opportunity to complete block diagrams using given information.
This downloadable Year 2 Pictograms and Block Diagrams Maths lesson includes a lesson plan, a slideshow presentation and printable teaching resources.
What's included:
- Lesson plan
- Slides
- Activity ideas
- Worksheets
- Extension Cards
- Graph Cards
- Statement Cards
- Squares of paper
- Photo Sheet
View Lesson 2
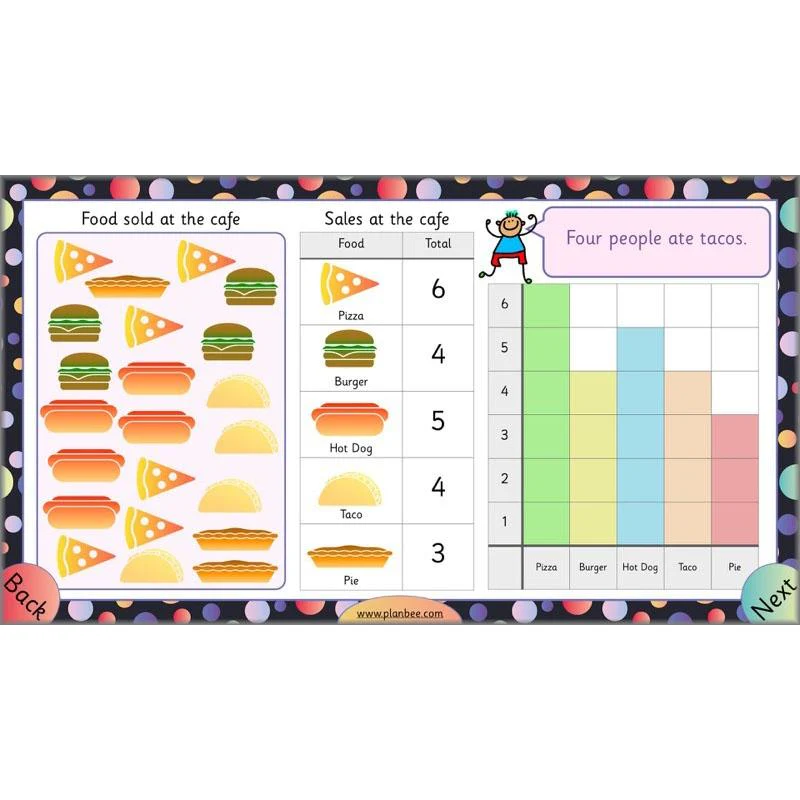
Sort Data into Block Graphs
Your class will recap what they have learned so far as they talk about tally charts, pictograms, tables and block diagrams. They will look closely to check graphs have been completed correctly before completing block graphs independently.
This downloadable lesson contains a lesson plan, a slideshow presentation and printable teaching resources.
What's included:
- Lesson plan
- Slides
- Activity ideas
- Worksheets
- Odd One Out Cards
- Photo Sheet
View Lesson 3
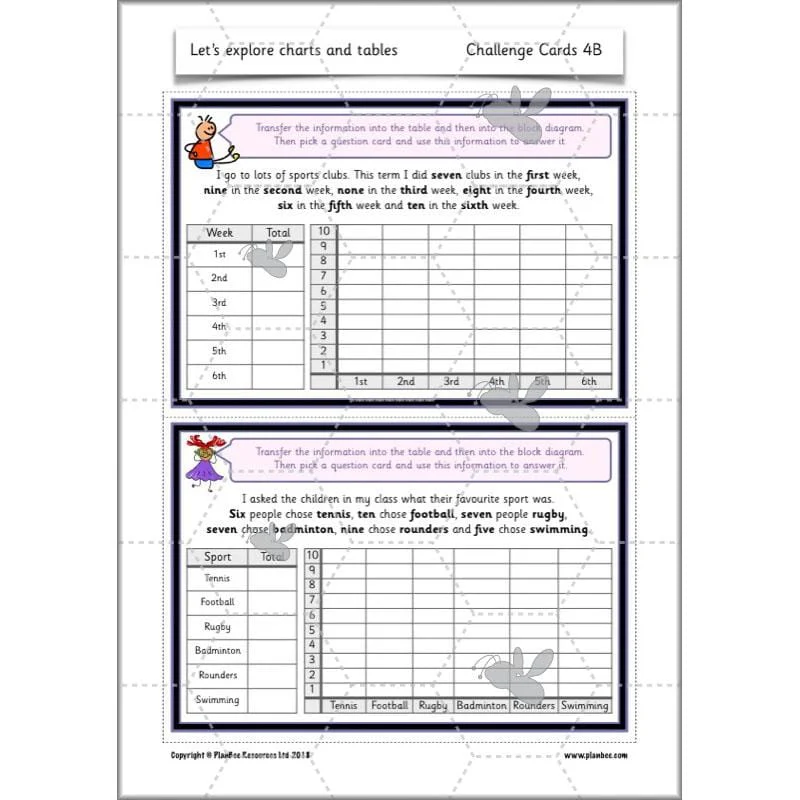
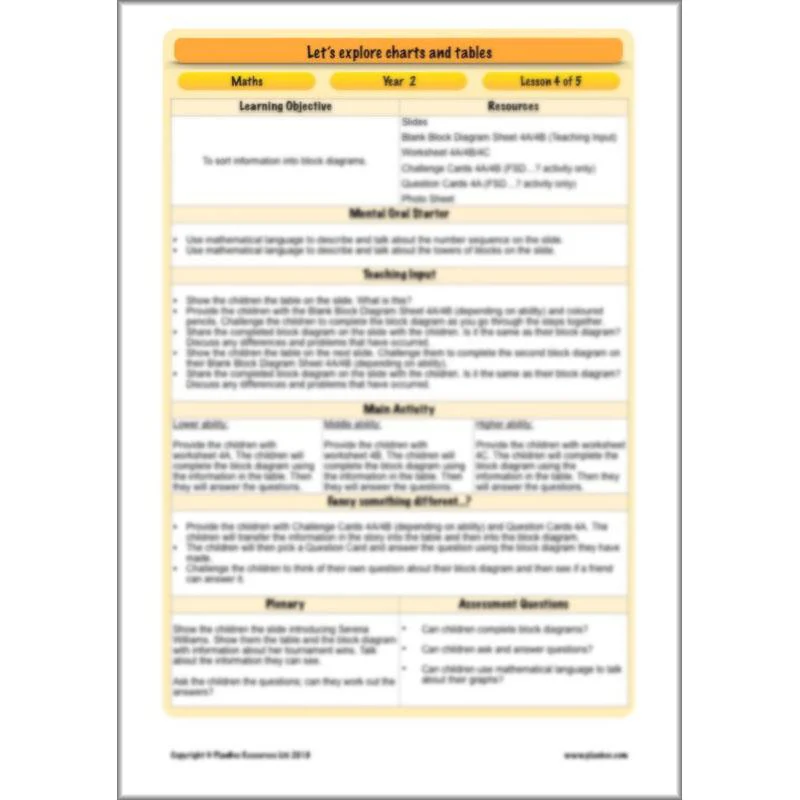
Sort information into block diagrams
During the penultimate lesson in this series your class will complete block diagrams using information given. They will discuss similarities and differences between their graph and the completed one on the slide. During the independent learning part of the lesson the children will ask and answer questions about block diagrams they have completed.
This downloadable lesson contains a lesson plan, a slideshow presentation and printable teaching resources.
What's included:
- Lesson plan
- Slides
- Activity ideas
- Blank Block Diagram Sheet
- Worksheets
- Challenge Cards
- Question Cards
- Photo Sheet
View Lesson 4
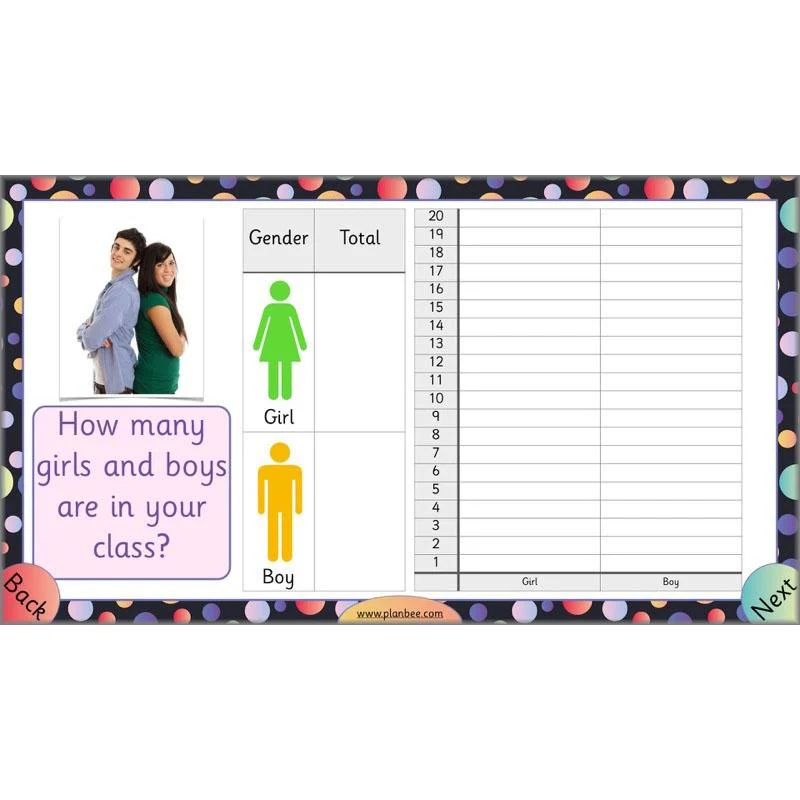
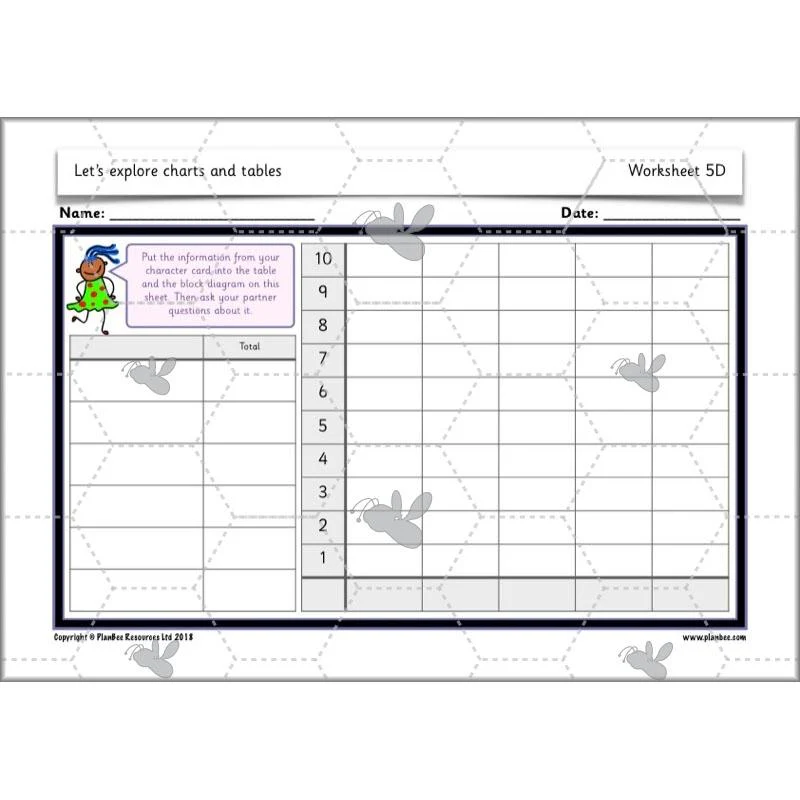
Generate information
In the final lesson of this series your class will collect data and record it in a table. They will need to work systematically to ensure they get accurate results. They will then input this information into a block diagram and ask and answer questions about it.
This downloadable lesson contains a lesson plan, a slideshow presentation and printable teaching resources.
What's included:
- Lesson plan
- Slides
- Activity ideas
- Worksheets
- Character Cards
- Trays of coloured blocks
- Photo Sheet
View Lesson 5
Original: $4.71
-65%$4.71
$1.65More Images


Let’s explore charts and tables
Explore tally charts, tables, pictograms and block diagrams in this scheme of work for Year 2. Your class will input given data into tables and charts, as well as generating some data of their own. They will be challenged to ask and answer questions about their tables and graphs.
This downloadable series of lessons includes lesson plans, slideshow presentations and printable teaching resources.
Using tallies and pictograms
In the first lesson in this series your class will explore pictograms and tally charts. They will ask and answer questions about the data they can see. The children will also use given information to complete tally charts and pictograms.
This downloadable Year 2 Tallies and Pictograms lesson includes a lesson plan, a slideshow presentation and printable teaching resources.
What's included:
- Lesson plan
- Slides
- Activity ideas
- Challenge Cards
- Picture Cards
- Worksheet
- Photo Sheet
View Lesson 1
Compare pictograms and block diagrams
In the second lesson of this series your class will compare pictograms and block diagrams. They will see the same information recorded in the two styles of graphs and talk about how they will use the graphs to answer given questions. They will discuss how the graphs are the same and how they are different. Your class will also have the opportunity to complete block diagrams using given information.
This downloadable Year 2 Pictograms and Block Diagrams Maths lesson includes a lesson plan, a slideshow presentation and printable teaching resources.
What's included:
- Lesson plan
- Slides
- Activity ideas
- Worksheets
- Extension Cards
- Graph Cards
- Statement Cards
- Squares of paper
- Photo Sheet
View Lesson 2
Sort Data into Block Graphs
Your class will recap what they have learned so far as they talk about tally charts, pictograms, tables and block diagrams. They will look closely to check graphs have been completed correctly before completing block graphs independently.
This downloadable lesson contains a lesson plan, a slideshow presentation and printable teaching resources.
What's included:
- Lesson plan
- Slides
- Activity ideas
- Worksheets
- Odd One Out Cards
- Photo Sheet
View Lesson 3
Sort information into block diagrams
During the penultimate lesson in this series your class will complete block diagrams using information given. They will discuss similarities and differences between their graph and the completed one on the slide. During the independent learning part of the lesson the children will ask and answer questions about block diagrams they have completed.
This downloadable lesson contains a lesson plan, a slideshow presentation and printable teaching resources.
What's included:
- Lesson plan
- Slides
- Activity ideas
- Blank Block Diagram Sheet
- Worksheets
- Challenge Cards
- Question Cards
- Photo Sheet
View Lesson 4
Generate information
In the final lesson of this series your class will collect data and record it in a table. They will need to work systematically to ensure they get accurate results. They will then input this information into a block diagram and ask and answer questions about it.
This downloadable lesson contains a lesson plan, a slideshow presentation and printable teaching resources.
What's included:
- Lesson plan
- Slides
- Activity ideas
- Worksheets
- Character Cards
- Trays of coloured blocks
- Photo Sheet
View Lesson 5
Product Information
Product Information
Shipping & Returns
Shipping & Returns
Description
Explore tally charts, tables, pictograms and block diagrams in this scheme of work for Year 2. Your class will input given data into tables and charts, as well as generating some data of their own. They will be challenged to ask and answer questions about their tables and graphs.
This downloadable series of lessons includes lesson plans, slideshow presentations and printable teaching resources.
Using tallies and pictograms
In the first lesson in this series your class will explore pictograms and tally charts. They will ask and answer questions about the data they can see. The children will also use given information to complete tally charts and pictograms.
This downloadable Year 2 Tallies and Pictograms lesson includes a lesson plan, a slideshow presentation and printable teaching resources.
What's included:
- Lesson plan
- Slides
- Activity ideas
- Challenge Cards
- Picture Cards
- Worksheet
- Photo Sheet
View Lesson 1
Compare pictograms and block diagrams
In the second lesson of this series your class will compare pictograms and block diagrams. They will see the same information recorded in the two styles of graphs and talk about how they will use the graphs to answer given questions. They will discuss how the graphs are the same and how they are different. Your class will also have the opportunity to complete block diagrams using given information.
This downloadable Year 2 Pictograms and Block Diagrams Maths lesson includes a lesson plan, a slideshow presentation and printable teaching resources.
What's included:
- Lesson plan
- Slides
- Activity ideas
- Worksheets
- Extension Cards
- Graph Cards
- Statement Cards
- Squares of paper
- Photo Sheet
View Lesson 2
Sort Data into Block Graphs
Your class will recap what they have learned so far as they talk about tally charts, pictograms, tables and block diagrams. They will look closely to check graphs have been completed correctly before completing block graphs independently.
This downloadable lesson contains a lesson plan, a slideshow presentation and printable teaching resources.
What's included:
- Lesson plan
- Slides
- Activity ideas
- Worksheets
- Odd One Out Cards
- Photo Sheet
View Lesson 3
Sort information into block diagrams
During the penultimate lesson in this series your class will complete block diagrams using information given. They will discuss similarities and differences between their graph and the completed one on the slide. During the independent learning part of the lesson the children will ask and answer questions about block diagrams they have completed.
This downloadable lesson contains a lesson plan, a slideshow presentation and printable teaching resources.
What's included:
- Lesson plan
- Slides
- Activity ideas
- Blank Block Diagram Sheet
- Worksheets
- Challenge Cards
- Question Cards
- Photo Sheet
View Lesson 4
Generate information
In the final lesson of this series your class will collect data and record it in a table. They will need to work systematically to ensure they get accurate results. They will then input this information into a block diagram and ask and answer questions about it.
This downloadable lesson contains a lesson plan, a slideshow presentation and printable teaching resources.
What's included:
- Lesson plan
- Slides
- Activity ideas
- Worksheets
- Character Cards
- Trays of coloured blocks
- Photo Sheet
View Lesson 5