Solving Data Problems
Get technical with your class as they learn how to read, interpret and construct a variety of charts and graphs. This ‘Solving Data Problems’ scheme of work for Year 6 will help you class understand how to use and create pie charts, line graphs and conversion graphs through a variety of fun and challenging problems and contexts.
Including detailed lesson plans, engaging slides, differentiated activity ideas and a range of printable resources, these KS2 Maths ‘Solving Data Problems’ lessons contain everything you need to teach your class the specifics of reading, presenting and interpreting data.
Interpreting Pie Charts
To kick things off, the included slides briefly recap features of pie charts. After that, children are presented with pie charts with errors which they must identify. Straightforward explanations of ways in which pie charts may be interpreted, and of how percentage amounts may be calculated are also shown. After that, there's a choice of activities where your class will have to read pie charts, then explain or present their own interpretations of the information shown.
This downloadable lesson includes a lesson plan, slideshow presentation and printable teaching resources.
What's included:
- Lesson plan
- Slides
- Activity ideas
- Differentiated worksheets
- Clothes Shop Challenge' sheets
Making Pie Charts
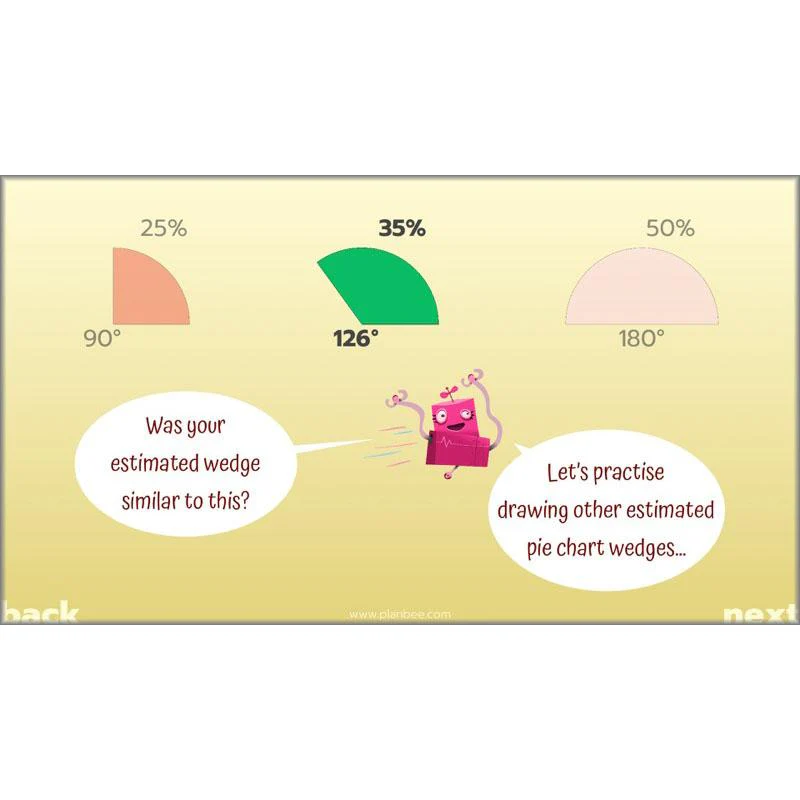
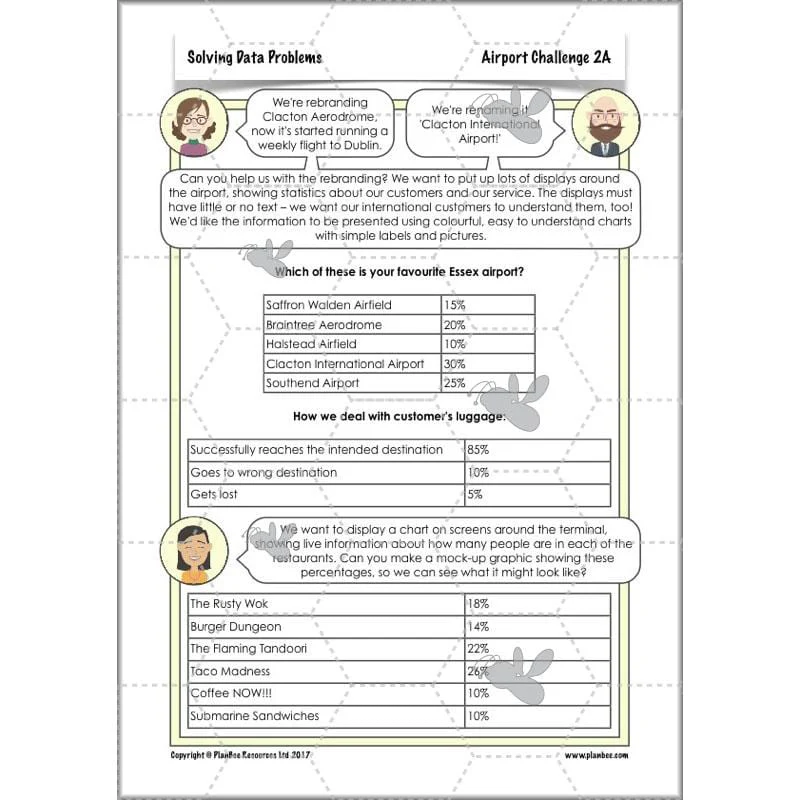
Show children how they can quickly draw 'estimated' pie charts to help visualise a table of information, and to help check accurately drawn pie charts. The included slides demonstrate how to draw pie charts, including how to translate percentages into degrees and how to round degrees with decimal numbers, making them easier to draw. After that there's a choice of challenging and creative activities where children will solve problems or design colourful pie chart graphics to show information in a way that is easy to understand.
This downloadable lesson includes a lesson plan, slideshow presentation and printable teaching resources.
What's included:
- Lesson plan
- Slides
- Activity ideas
- Differentiated 'Airport Challenge' sheets
- Station Clues' cards
Interpreting Line Graphs
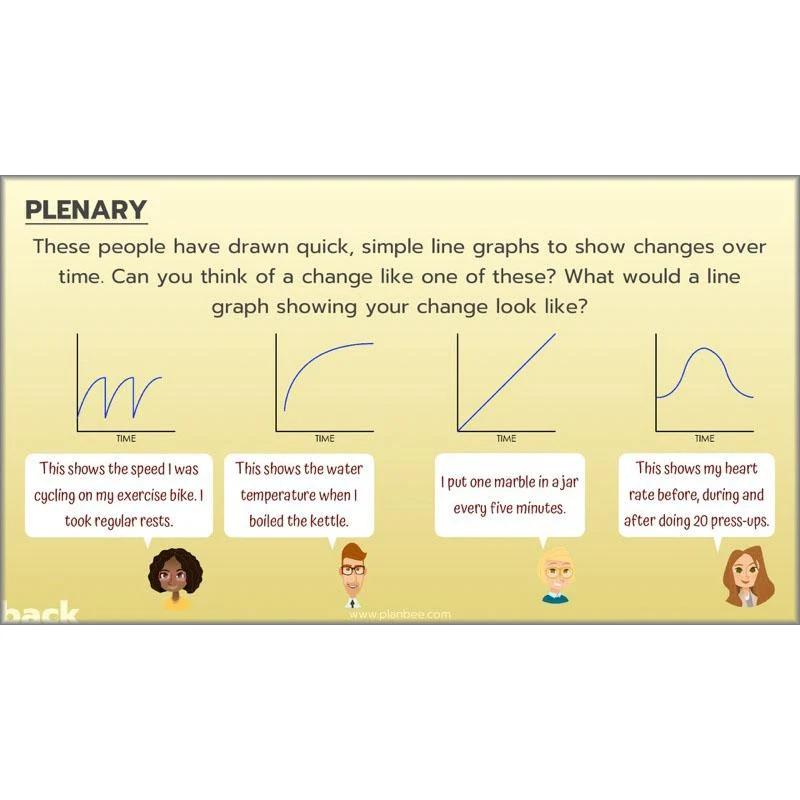
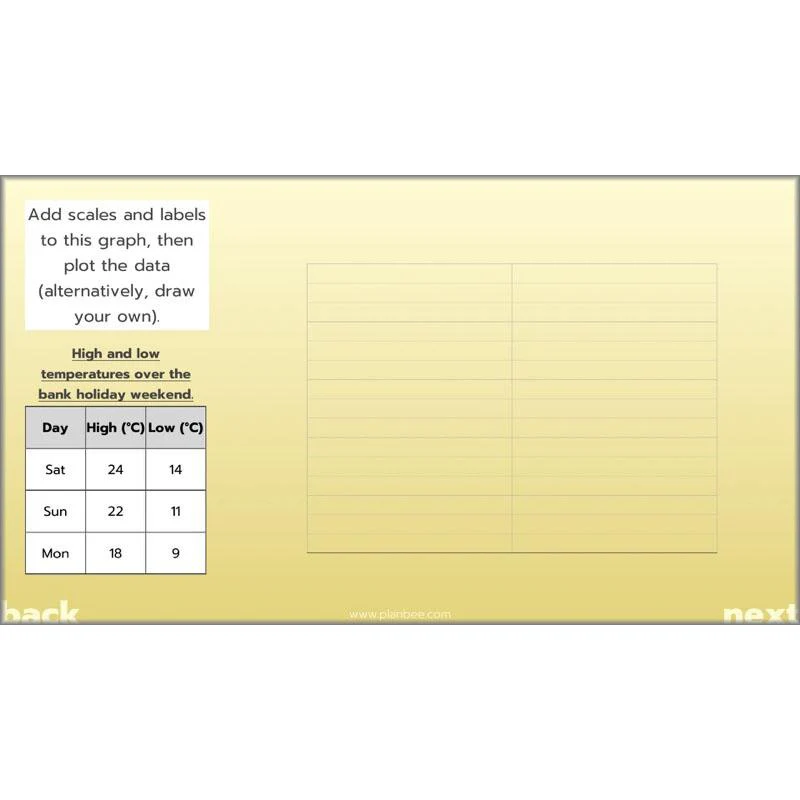
Start this lesson by exploring a variety of different line graphs and what they show with your class, identifying the difference between continuous and discrete data. They will have lots of opportunities to practise reading, creating and interpreting line graphs, including those with more than one variable.
This downloadable lesson includes a lesson plan, slideshow presentation and printable teaching resources.
What's included:
- Lesson plan
- Slides
- Activity ideas
- Differentiated worksheets
- Business report challenge sheet
- Differentiated charts and graphs
Conversion Graphs
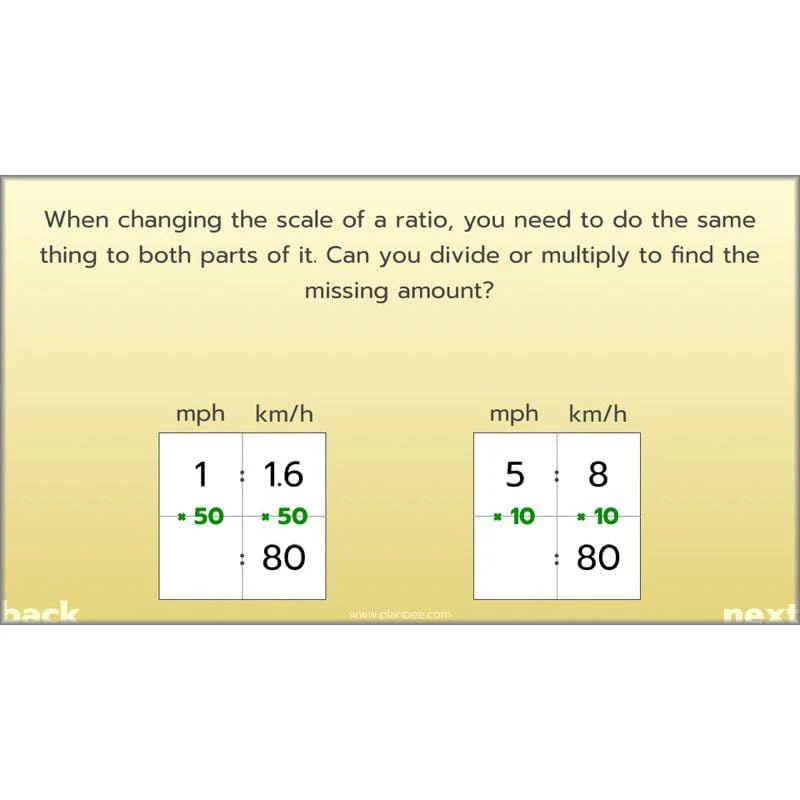
Your class will start by looking at how simple conversions can be solved using a four-cell ratio model before quickly finding out that this is only useful for simple conversions! They will then go on to study a variety of conversion graphs for themselves, considering what they show and how they have been constructed. They are then challenged to create some accurate conversion charts of their own.
This downloadable lesson includes a lesson plan, slideshow presentation and printable teaching resources.
What's included:
- Lesson plan
- Slides
- Activity ideas
- Challenge card
- Converting currency sheet
Report Writers
The final lesson in this series gives your class the chance to consolidate everything they have learnt about pie charts, line graphs and conversion graphs. The slides go through some questions to remind them of what they have learnt and assess their understanding. They are then challenged to create a detailed report of their own, using either given data or data about an aspect of their own life, deciding which data to present in which way.
This downloadable lesson includes a lesson plan, slideshow presentation and printable teaching resources.
What's included:
- Lesson plan
- Slides
- Activity ideas
- Annual report sheet
- Annual report form
- Challenge card
Original: $4.71
-65%$4.71
$1.65More Images


Solving Data Problems
Get technical with your class as they learn how to read, interpret and construct a variety of charts and graphs. This ‘Solving Data Problems’ scheme of work for Year 6 will help you class understand how to use and create pie charts, line graphs and conversion graphs through a variety of fun and challenging problems and contexts.
Including detailed lesson plans, engaging slides, differentiated activity ideas and a range of printable resources, these KS2 Maths ‘Solving Data Problems’ lessons contain everything you need to teach your class the specifics of reading, presenting and interpreting data.
Interpreting Pie Charts
To kick things off, the included slides briefly recap features of pie charts. After that, children are presented with pie charts with errors which they must identify. Straightforward explanations of ways in which pie charts may be interpreted, and of how percentage amounts may be calculated are also shown. After that, there's a choice of activities where your class will have to read pie charts, then explain or present their own interpretations of the information shown.
This downloadable lesson includes a lesson plan, slideshow presentation and printable teaching resources.
What's included:
- Lesson plan
- Slides
- Activity ideas
- Differentiated worksheets
- Clothes Shop Challenge' sheets
Making Pie Charts
Show children how they can quickly draw 'estimated' pie charts to help visualise a table of information, and to help check accurately drawn pie charts. The included slides demonstrate how to draw pie charts, including how to translate percentages into degrees and how to round degrees with decimal numbers, making them easier to draw. After that there's a choice of challenging and creative activities where children will solve problems or design colourful pie chart graphics to show information in a way that is easy to understand.
This downloadable lesson includes a lesson plan, slideshow presentation and printable teaching resources.
What's included:
- Lesson plan
- Slides
- Activity ideas
- Differentiated 'Airport Challenge' sheets
- Station Clues' cards
Interpreting Line Graphs
Start this lesson by exploring a variety of different line graphs and what they show with your class, identifying the difference between continuous and discrete data. They will have lots of opportunities to practise reading, creating and interpreting line graphs, including those with more than one variable.
This downloadable lesson includes a lesson plan, slideshow presentation and printable teaching resources.
What's included:
- Lesson plan
- Slides
- Activity ideas
- Differentiated worksheets
- Business report challenge sheet
- Differentiated charts and graphs
Conversion Graphs
Your class will start by looking at how simple conversions can be solved using a four-cell ratio model before quickly finding out that this is only useful for simple conversions! They will then go on to study a variety of conversion graphs for themselves, considering what they show and how they have been constructed. They are then challenged to create some accurate conversion charts of their own.
This downloadable lesson includes a lesson plan, slideshow presentation and printable teaching resources.
What's included:
- Lesson plan
- Slides
- Activity ideas
- Challenge card
- Converting currency sheet
Report Writers
The final lesson in this series gives your class the chance to consolidate everything they have learnt about pie charts, line graphs and conversion graphs. The slides go through some questions to remind them of what they have learnt and assess their understanding. They are then challenged to create a detailed report of their own, using either given data or data about an aspect of their own life, deciding which data to present in which way.
This downloadable lesson includes a lesson plan, slideshow presentation and printable teaching resources.
What's included:
- Lesson plan
- Slides
- Activity ideas
- Annual report sheet
- Annual report form
- Challenge card
Product Information
Product Information
Shipping & Returns
Shipping & Returns
Description
Get technical with your class as they learn how to read, interpret and construct a variety of charts and graphs. This ‘Solving Data Problems’ scheme of work for Year 6 will help you class understand how to use and create pie charts, line graphs and conversion graphs through a variety of fun and challenging problems and contexts.
Including detailed lesson plans, engaging slides, differentiated activity ideas and a range of printable resources, these KS2 Maths ‘Solving Data Problems’ lessons contain everything you need to teach your class the specifics of reading, presenting and interpreting data.
Interpreting Pie Charts
To kick things off, the included slides briefly recap features of pie charts. After that, children are presented with pie charts with errors which they must identify. Straightforward explanations of ways in which pie charts may be interpreted, and of how percentage amounts may be calculated are also shown. After that, there's a choice of activities where your class will have to read pie charts, then explain or present their own interpretations of the information shown.
This downloadable lesson includes a lesson plan, slideshow presentation and printable teaching resources.
What's included:
- Lesson plan
- Slides
- Activity ideas
- Differentiated worksheets
- Clothes Shop Challenge' sheets
Making Pie Charts
Show children how they can quickly draw 'estimated' pie charts to help visualise a table of information, and to help check accurately drawn pie charts. The included slides demonstrate how to draw pie charts, including how to translate percentages into degrees and how to round degrees with decimal numbers, making them easier to draw. After that there's a choice of challenging and creative activities where children will solve problems or design colourful pie chart graphics to show information in a way that is easy to understand.
This downloadable lesson includes a lesson plan, slideshow presentation and printable teaching resources.
What's included:
- Lesson plan
- Slides
- Activity ideas
- Differentiated 'Airport Challenge' sheets
- Station Clues' cards
Interpreting Line Graphs
Start this lesson by exploring a variety of different line graphs and what they show with your class, identifying the difference between continuous and discrete data. They will have lots of opportunities to practise reading, creating and interpreting line graphs, including those with more than one variable.
This downloadable lesson includes a lesson plan, slideshow presentation and printable teaching resources.
What's included:
- Lesson plan
- Slides
- Activity ideas
- Differentiated worksheets
- Business report challenge sheet
- Differentiated charts and graphs
Conversion Graphs
Your class will start by looking at how simple conversions can be solved using a four-cell ratio model before quickly finding out that this is only useful for simple conversions! They will then go on to study a variety of conversion graphs for themselves, considering what they show and how they have been constructed. They are then challenged to create some accurate conversion charts of their own.
This downloadable lesson includes a lesson plan, slideshow presentation and printable teaching resources.
What's included:
- Lesson plan
- Slides
- Activity ideas
- Challenge card
- Converting currency sheet
Report Writers
The final lesson in this series gives your class the chance to consolidate everything they have learnt about pie charts, line graphs and conversion graphs. The slides go through some questions to remind them of what they have learnt and assess their understanding. They are then challenged to create a detailed report of their own, using either given data or data about an aspect of their own life, deciding which data to present in which way.
This downloadable lesson includes a lesson plan, slideshow presentation and printable teaching resources.
What's included:
- Lesson plan
- Slides
- Activity ideas
- Annual report sheet
- Annual report form
- Challenge card